


Despite a bearish week in the Polkadot (DOT) market with a dip from a 7-day high of $6.79 to a weekly low of $6.08, bulls have opened the week in a rally. In the last 24 hours, after support was established at the intra-day low of $6.17, bulls reclaimed market control, soaring the price to an intra-day high of $6.42, where support was established. However, as of press time, bears had managed to shift control with DOT exchanging hands at $6.14, a 0.75% decline.
Concurrently, DOT’s market capitalization declined by 0.71% to $8,812,269,492. However, with the ongoing price dip, traders are taking advantage, as seen in the surge in 24-hour trading volume by 80% to $168,941,643.
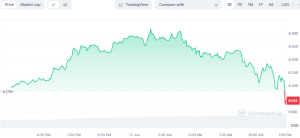

DOT/USD 1-day price chart (source: CoinMarketCap)
If this bearish rally persists and the $6.12 support does not hold, the DOT price may retest the weekly low of $6.08, which may set a precedence for a bearish week. On the other hand, a bullish reversal may test resistance at $6.25 and $6.35 respectively. Moreover, DOT must bounce from the $6 support to remain bullish. If it fails, DOT maybe in danger in the short term.
Despite these bearish conditions, analysts are bullish on the DOT price trend in the long term. Michael Van de Pope, a crypto analyst, claimed that the DOT price trend has reached a support area that precedes an accumulation period, which a bullish breakout may reward.
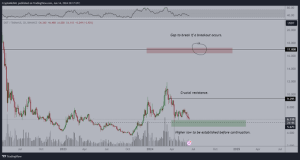

According to him, this trend aligns with the Real World Assets (RWA) increasing interest and rising number of projects within the Polkadot ecosystem. Consequently, the analyst suggests that this trend may set a rally toward the $17 target in the coming months as long as it manages to breach the $9 resistance.
Another analyst, World of Charts, suggested that the DOT market is making a falling wedge pattern, which may set the stage for a breakout toward $11 resistance. Concurrently, with the community anticipating DOT 2.0 and the many projects utilizing Polkadot for AI integration, analyst views may be achieved.
DOT/USD Technical Analysis
On the DOTUSD 24-hour price chart, the Moving Average Convergence Divergence (MACD) is moving below its signal line with a rating of -0.24. This trend suggests that the bears are in control with the increased selling pressure. Moreover, the histogram trend in the negative region suggests that the bear’s hold is strengthening, which may lead toa retest of the weekly low.
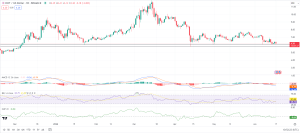

In addition, the Relative Strength Index (RSI) shift toward the oversold region points to more price decline. With the RSI yet to be oversold, traders should be wary about a continued bear rally. The Chaikin Money Flow (CMF) rating of -0.04 also suggests a bearish continuation since it suggests money is flowing out of the market.


