


Polkadot (DOT) price has recovered in the past 24 hours despite a fluctuating market landscape, indicating a potential shift in sentiment. Despite recent challenges, the cryptocurrency managed to rebound from a lower price point, sparking questions about the sustainability of this bullish momentum.
DOT Price Movement
The recent price movement of Polkadot (DOT) cryptocurrency has been marked by a tug-of-war between bears and bulls, with fluctuations evident in the chart analysis. The price initially experienced a downtrend, characterized by a drop to a lower level, signaling a bearish sentiment prevailing in the market.
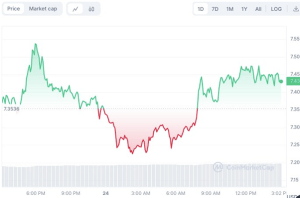

DOT/USD 24-hour price chart (source: CoinMarketCap)
However, amidst this downward pressure, Polkadot found support around the $7.35 mark, prompting a rebound in its price. This bounce-back suggests a temporary halt to the downward movement and hints at a potential shift towards bullish sentiment. Furthermore, the recent upward trend has led to a 1.36% increase in the price of Polkadot over the past day, reflecting renewed buying interest in the cryptocurrency.
Technical Indicators and Market Analysis
Despite the recent recovery, Polkadot’s price faces conflicting technical signals, making future price movements uncertain. While some technical indicators point towards a potential price dip, others suggest a bullish outlook for the cryptocurrency.
Analysts have identified the breach of the lower boundary of Polkadot’s ascending trend channel, a pattern often associated with weakening momentum. Additionally, trading volume leans towards a bearish sentiment, with sellers dominating the market and exerting downward pressure on the price.
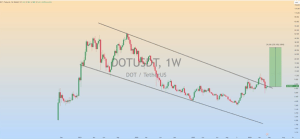

DOT/USD 1-week price chart (source: TradingView)
However, Polkadot proponents remain optimistic, pointing to a bullish flag pattern that indicates a consolidation phase. This consolidation is viewed as a healthy pause in price action, allowing for accumulation before the next significant movement. Prominent analysts, such as World of Charts, anticipate a breakout from this consolidation phase, with Polkadot potentially reaching $15 in the coming weeks.
DOT/USD 4-Hour Analysis
On the 4-hour chart for the DOT/USD pair, traders are closely observing the price action, particularly in relation to the Keltner Channels indicator. Trend analysis reveals that DOT has been recovering following a notable decline, with the price trending higher within a narrower band between the middle and upper Keltner Channels.
Notably, the lower bounds of the Keltner Channel have acted as a sturdy support level, while the upper bounds have served as resistance. The gradual narrowing of the channel preceding the recent price uptick suggests decreasing volatility and the possibility of a breakout.
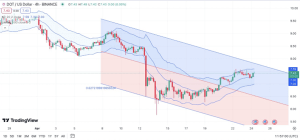

DOT/USD 4-hour price chart (source: TradingView)
Regarding support and resistance levels, traders are eyeing the immediate support near the recent lows, corresponding to the lower Keltner Channel around the $7.00 mark. A breach below this level could signal a potential move toward the support region near $6.50, as indicated by the lower extremity of the visible price action on the chart.
Conversely, resistance is observed around the upper Keltner Channel, just below $7.60, with further resistance anticipated at previous local highs near $8.50 and beyond.
Assessing the indicator’s trend, the upward trajectory of the middle Keltner Channel line indicates a prevailing short-term bullish momentum for DOT. This upward slope reflects an increasing average price over time, suggesting positive market sentiment. Additionally, the recent price action, characterized by smaller body candles and shorter shadows following a significant downward movement, implies diminishing selling pressure and a potential shift in market sentiment.


