


In recent trading sessions, Polkadot (DOT) has experienced a noteworthy decline, emphasizing a challenging period for the cryptocurrency amidst a broader market downturn. As of the latest updates, DOT has been trading around the $6.59 mark, struggling to surpass the resistance level at $7. This ongoing weakness in price action aligns with the negative trends observed across major cryptocurrencies, including Bitcoin and Ethereum.


DOT/USD 24-hour price chart (source: CoinMarketCap)
During the dip, DOT’s market capitalization and 24-hour trading volume dipped by 0.49% and 2.14% to $9,479,632,484 and $211,466,224, respectively.
Market Resistance and Support Levels
Polkadot’s market behavior has seen the cryptocurrency find a robust support level at $6, below which market forces have resisted further declines. On the flip side, the $7 mark, coinciding with the 200-day Simple Moving Average (SMA), has acted as a significant barrier preventing upward movements. Recently, DOT reached a weekly high of $7.21 but failed to maintain these levels as selling pressure pushed its value back below the resistance.
This price movement is critical as it encapsulates the struggle between bearish and bullish sentiments in the market, setting the stage for possible future fluctuations. If DOT continues to face rejection at this key resistance level, there could be potential for further slides toward lower support zones.
Analyzing Technical Indicators
Technical indicators provide a deeper insight into the ongoing market trends affecting DOT’s price. The Moving Average Convergence Divergence (MACD) and the Relative Strength Index (RSI) both indicate a bearish outlook in the short term. Such metrics are crucial for investors and traders as they attempt to gauge potential market movements and prepare for either sustained lows or a possible reversal if bullish forces regain strength.
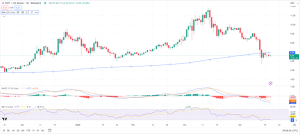

DOT/USD 24-hour price chart (source: TradingView)
The importance of maintaining the $6 support level cannot be overstated, as falling below this threshold could trigger additional sell-offs targeting lower supports around $5.50 or $5. Conversely, a shift in market sentiment that propels DOT above the $7 resistance might pave the way for an approach toward the next critical levels at $8 and $9, marked by the 20-day and 50-day SMAs, respectively.
Influence of the Futures Market
The dynamics within the perpetual futures market have also played a pivotal role in influencing DOT’s price trajectory. An analysis of Polkadot’s Open Interest (OI) in the futures market reveals a sharp decline in tandem with its price, a movement further exacerbated by geopolitical uncertainties affecting global markets. This drop in OI signifies a reduction in active contracts and could be indicative of a cooling-off period within the market.
However, the futures market remains a key area to watch, as an influx of new contracts could reintroduce heightened volatility and influence DOT’s price direction. Tracking these developments will be essential for market participants looking to anticipate and react to price changes caused by shifts in trader sentiment within the futures market.


