


The Indian stock market shows strong bullish momentum today, August 20th. The Nifty 50 index opened at Rs. 24,648.90 and has since been as high as Rs. 24,734.30 and low as Rs. 24,607.20. It closed at Rs. 24,712.00 yesterday and is currently up by 139.35 points or +0.57% so far.
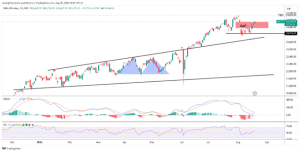

The current technical analysis puts it at Rs. 24,712.00. The chart shows an uptrend with a recent gap that had to be filled. The creation of higher highs and higher lows indicates that we are having a bullish pattern. Major support is placed around Rs 24, 074 where the price could find a cushion if it retraces back down from there. The MACD indicator is in negative territory but also showing some signs of convergence indicating a possible bullish crossover.Based on RSI score of 58.45, there appears to be mild bullish momentum. If prices cross above the gap, then next target lies at about 25, 078. However if it fails to hold , then pullback toward the support level could be expected.
S&P BSE Sensex Index Analysis
Rs 80,722.54 was the opening price for S&P BSE Sensex while its high was at Rs 80, 938.28 and low at Rs 80,517.95. Today’s gain so far is +456.26 or +0.57%.
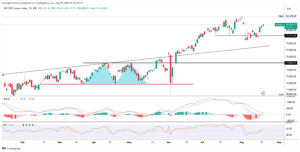
The current Sensex chart reveals a continuation of a bullish pattern as seen by higher highs where the index made higher highs recently. We have resistance at around Rs 82,129 as our next target. On the other hand, support can be found around Rs 79,223. MACD is acting positively, whereby the MACD line is above the signal line thus confirming an uptrend. RSI at 57.76 suggests a rise in the index before it can get overbought. If this current bullish thrust continues, Sensex is aiming at Rs 82,129 high. Nevertheless, falling below Rs79,223 may imply a deeper correction and support can be found at the ascending trendline.
Nifty Bank Index Analysis
The Nifty Bank index started at Rs 50, 417.25 and reached a high of Rs 50, 994 and a low of Rs 50, 398;60 as of writing. Since opening today it has added 555.55 or +1.10% so far.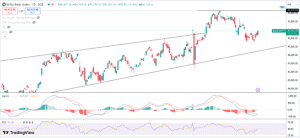

Trading at Rs 50,923.90, the Nifty Bank Index is currently approaching resistance at last higher high. A key support level is around Rs 49,000 which corresponds with an ascending trendline. The MACD indicates a negative trend as the MACD line remains below the signal line, though today’s rise shows signs of a potential bullish crossover. The RSI at 50 suggests a neutral standpoint with building uptrend momentum. If the index continues its uptrend, the next target could be Rs 53,357.05, while a drop may signal a test of the trendline support at around Rs 49,000.


