


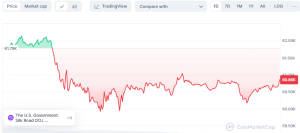
Bitcoin’s price is in a downtrend, falling sharply to almost $60,000 from the recent high of $70,000. QCP Capital has attributed this correction to an unanticipated upsurge in bitcoin supply and poor macroeconomic conditions. At press time, BTC was trading at $60,857, a 1.50% decline from the 24-hour high.

Surge in Bitcoin Supply Triggers Market Correction
QCP Capital highlights that there has been a significant increase in the amount of Bitcoin entering the market, which is the main reason for the decline in prices. The sale of these coins includes over 28K Bitcoins released by the US government, redistribution of 33,960 Bitcoins through Mt Gox settlement, and Genesis creditors distributing 1.5 billion worth of Bitcoin and ether combined.
These events have had huge adverse effects on Bitcoin’s value as they rapidly decreased its price.
QCP Weekend Brief – 2 Aug 24
This week saw the market rudely reversing the Trump crypto boost with BTC price retracing from the post-speech high of 70k to almost 60k this morning.
— QCP Capital (@qcpcapital) August 3, 2024
Furthermore, there has been growing pressure on miners to liquidate their assets due to an upward surge in mining difficulty, which rose by 10.5%, reaching peak levels. Miners are under more strain than before since more coins are now coming into circulation, and mining is becoming harder.
Macroeconomic Indicators Add to Bearish Sentiment
Another factor that QCP Capital is pointing at in worsening macroeconomic indicators influencing a bearish mood of the entire market is the Cboe Volatility Index. This was another indicator of a worsening economy with an unexpected unemployment rate hike to 4.3% and concerns among investors about approaching recession. Meanwhile, VIX gained the highest level in March 2023 since banking issues in regions reached above 28, further intensifying the anxiety on markets.
Surprisingly, despite these turbulent market conditions, there seemed to be no corresponding movement along crypto volatility measures. As such, Bitcoin and Ether volatility remained relatively steady throughout this period, with front-end Bitcoin volatility rising slightly from 45% to 48%, while the back-end showed no change at all. Therefore, it suggests that despite ups and downs, the recent price surge may result in stabilizing future months’ prices.
Criticisms and Warnings from Market Analysts
Leading Bitcoin opponent Peter Schiff has once again reiterated his bearish view on Bitcoin, highlighting that it has been in a bear market for years now. He added that Bitcoin is down by 34% against gold since reaching its peak last November. At one point on Saturday, bitcoin dropped down as far as $59,839, marking its lowest level since July 14th.
Bitcoin just broke $60K. It’s now down 19% from its high. But in terms of real #gold, which is the best way to measure its price, its down 34% since hitting its high in Nov. 2021. #Bitcoin has been in a major bear market for almost three years and #HODLers still don’t realize it.
— Peter Schiff (@PeterSchiff) August 3, 2024
In addition, he expects creditors could force MicroStrategy (the biggest corporate holder of bitcoins) to dispose of their current holdings. However, traders are more frightened than usual (with fear standing at 34 points out of a possible hundred), considering that the “Fear & Greed” index measures public sentiment.
Technical Analysis Suggests Potential Rebound
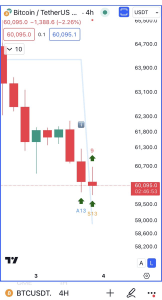
However, some analysts believe we may be due for a bounce-back, while others do not agree. A popular crypto analyst on platform X, Ali Martinez, identified multiple buy signals on the Bitcoin four-hour chart based on the TD Sequential Indicator. This means that although trend reversals are still seen around those levels, they signal long dollar opportunities after downward movements and momentum loss.
But if this support breaks next time round should there be no rebounding price, Bitcoin may fall further to $57,000. At the time of writing this article, Bitcoin is trading just above $61,000, which is slightly higher than prices over the past day.

Concurrently, despite its recent price uptrend, bitcoin’s on-chain activity has slowed down. According to Galaxy Research data, meme coins account for 35% of transactions on the BTC blockchain since January 1st. This shows that even after the most bullish period in its history over the last two years or so, monthly users are still at similar levels to early 2019 when the coin was worth about $4k.
Bitcoin is now in an upward multi-month trend, which analysts say might sweep liquidity at $58,500 and then rally up towards its target of $70,000.MACD (the Moving Average Convergence Divergence), a technical indicator, confirms such a speculation by posting that the underlying negative trend would make BTC sweep liquidity at the support level.


