


Bitcoin (BTC) is currently experiencing bearish pressure at $64k following a slump from the crucial $67k. The trading volume for BTC has surged by 25.61% in the last 24 hours, reaching approximately $83 billion, indicating robust market interest and increased trading activity. Major exchanges are seeing significant volumes, with Binance leading at $23.56 billion, followed by Bitget, Bybit, and OKX. This heightened trading activity is crucial for Bitcoin’s market momentum, contributing to its current market capitalization of $1.27 trillion.
Although it is down by just 0.03% over the past day, it has risen by 3.04% in the last thirty days while selling at $64,476.35 per coin signifying that bitcoin continues to perform well on an annual basis despite recent fluctuations seen as a temporary correction rather than a bearish reversal.
Bitcoin Faces Volatility and Market Uncertainty Ahead of Historic Negative Sentiment
There have been heated debates amongst cryptocurrency enthusiasts since BTC fell sharply from its all-time high of around $70K to lows below $63K.Geopolitical tensions and substantial sell-off have led to volatile conditions. The global crypto market cap is currently at $2.4tn with BTC holding a 52.92% market dominance.
August presents challenges for Bitcoin as historically over the last thirteen years the asset loses an average of 15.4%. This year traders are wary given historical data that there might be possible downturns.Besides, there have been huge liquidations in crypto markets within the last twenty-four hours; this caused liquidations totaling $253m among eighty-eight thousand six hundred thirty-one traders.Volatility remains high as can be seen from recent price movements of BTC including reaching$70k followed by sharp correction, showing that the asset is still not stable.
Bitcoin Undergoes Intense Volatility as It Seeks Vital Support Levels
Currently, Bitcoin (BTC) is experiencing a volatile market condition having gone below the $64,500 level lately.The daily chart shows that Bitcoin is testing the key support level of $64,402 which is also its 50-day Simple Moving Average (SMA), marking a significant bullish support sign. If this level fails to hold, BTC might revisit the $63,130 support line in confluence with the 100-day SMA. However, BTC’s present price movements show that it struggles to break above resistance located at $66,421 while the wider ranged resistance stands at $72,065 as this indicates caution on the part of traders despite bullish signals. The MACD indicator reinforces this cautious attitude by showing a bearish crossover with MACD line under the signal line and by way of red histogram bars indicating shift in momentum.
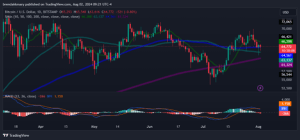

Nonetheless, increased trading volumes and Open Interest reveal that Bitcoin bulls are not sleeping on their responsibilities hence there is still positive interest in upward price momentum.If it can close at or above $66k and keep holding onto strong support around $63k then it may point towards a short term rally with an eye on higher resistance levels.Should anything go wrong within these current support zones for example due to macroeconomic factors or liquidation events escalating fears within markets otherwise could possibly lead to further declines.As it enters August known for its volatility in BTC history, traders will be faced by potential swings based on how market dynamics are shaping up.


