


The price of Pepe (PEPE) has been quite volatile in the past few days, attributable to the bearish sentiment in the whole crypto market. Consequently, the PEPE price fluctuated and reached a 24-hour high of around $0.0000120, later dropped to about $0.0000110, and is currently trading at $0.00001184.
Concurrently, in the last 24 hours, PEPE’s trading volume has decreased by 14.19%. In addition, PEPE’s market capitalization has dropped by 0.70% and currently stands at around $4,952,657,574. Beyond that, according to Etherscan, the number of holders of PEPE has exceeded 264,000, attesting to the interest in the coin.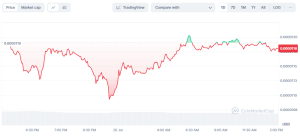

Source: CoinMarketCap
This volatility has been linked with an increase in trading volume which may be suggestive of enhanced interest or enhanced activities in the market pertaining to the said coin. Therefore, this trend implies that traders are indeed buying the dip with the view of the price bouncing back. This signifies that the number of people holding a certain coin is increasing and more and more people are developing interest and confidence towards PEPE.
Pepe Derivatives Chart
Open interest has also declined by 1.31% to $134.78 million. This slight decrease, combined with the overall trading volume decrease of 38%, may indicate that traders are starting to close their positions.
Net liquidations were $496.28k in the last 12 hours, with $83.61k from longs and $412.67k from shorts. A greater liquidation from shorts hints that this period witnessed a bullish flip.
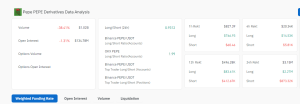

Source: Coinglass
However, despite the bullish stance, there has been $3.15 million worth of liquidation in the last 24 hours: $2.27 million from longs and $873.32k from shorts. This high liquidation from longs shows a strong bearish pressure at this time frame.
PEPE Technical Analysis
The zigzagging pattern on the PEPE chart indicates price oscillations within a ranging point. Currently, critical areas with resistance levels are around $0.0000120, while support is around $0.0000110. According to Mags, a crypto analyst, PEPE had an underlying strength on the charts.
Subsequently, this means that the dip experienced in the recent session was a trap that lifted the price to recover above $0.00001086, indicating that the bears’ potential move south is invalid. Bollinger Bands points out that the price is heading toward the upper boundary, thus forming overbought conditions in the market. If it crosses the band, it might lead to a resistance area and result in a move back.
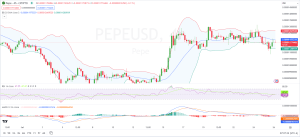

Source: TradingView
Place stop-loss just below the recent support line of $0.0000110 to manage the risk, especially if a sign in the market shows weakness in the reversal back to the bearish trend. The Relative Strength Index is 52, which is above the middle or neutral line of 50, suggesting that the market is not over-sold or over-bought. Nonetheless, if bulls can break through the 60-70 level in RSI, it will strengthen this ongoing bullish reversal.
Also, the Moving Average Convergence Divergence showed that the MACD line was close to the signal line indicating a bullish crossover and upward trend. If this is to happen, it would serve to confirm the existence of a bullish rally in the offing.


