


The Pepe price is trading at $0.00001244 as of 12:30 am EST, up 5% over the last 24 hours.
The price of the Ethereum-based memecoin is up 50% over the last ten days in a rally that saw PEPE rise above the $0.000012 level, reaching as high as $0.00001289 on July 17. Supplier congestion around $0.0000129 has kept the price lower as bulls fight to keep the price above $0.000012.
Despite this resistance, Pepe still displayed strength with a bullish technical formation bringing areas above $0.000018 into the picture.
From a technical perspective, the ongoing correction in PEPE’s price action is nothing to worry about. The Pepe price action has led to the appearance of a bull flag on the daily chart, as shown in the figure below.
This technical setup is formed by two rallies separated by a brief consolidating retracement period. The flagpole forms an almost vertical price spike as sellers get blindsided by the buyers, then a pullback that has parallel upper and lower trendlines, which form the flag.
The technical formation is confirmed when the price breaks above the flag’s upper boundary to the upside. The target is reached by adding the percentage in the flag’s posts to the breakout point. In this case, the flag’s target is set at $0.0000 1881 for the PEPE price and beyond.
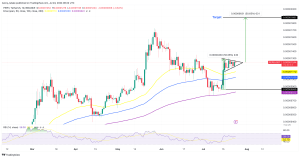

PEPE/USD daily chart. Source: TradingView
Apart from the significantly bullish technical formation, PEPE’s upward outlook is supported by the upward-facing moving averages (MAs). These MAs also provide areas of strong support on the downside, as shown by data from market intelligence firm IntoTheBlock.
Its In/Out of the Money Around Price (IOMAP) showed that the 50-day EMA at $0.00001110 lies within the $0.000011 to $0.000012 price range, where more than 25.23 trillion PEPE were previously bought by approximately 7,390 addresses.
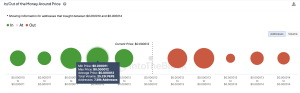

PEPE IOMAP chart. Source: IntoTheBlock
As such, any attempts to pull the price lower would be met by aggressive buying from this cohort of investors who would love to see their profits increase.
Conversely, a daily candlestick close below $0.0000120 would suggest the inability of the buyers to sustain the higher levels as sellers continue booking profits on the latest rally.
Key levels to watch on the downside are the 50-day EMA at $0.00001110, the 100-day EMA at $0.00001030, the $0.000010 psychological level and finally, the start of the flag post at $0.00000822. Such a move would erase all the gains made over the last two weeks, invalidating the bullish thesis


