


Pepe Coin (PEPE) has been the leading meme crypto recently and has firmed its position in the global crypto market, landing among the top 25 by market cap. Despite an overall drop in the trading volumes across crypto market this Monday June 10th, PEPE has maintained its dominance in its category with a daily trading volume exceeding $1.2 billion
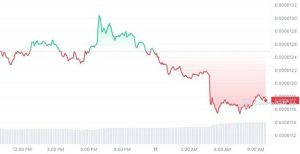

PEPE Price Chart: Coinmarketcap
Currently priced at $0.0000117 PEPE has experienced a decline of 6.01% in the last 24 hours and over 17% in the last 7 days. Despite this recent dip PEPE has managed an impressive market cap of approximately $4.95 billion securing the 23rd position in the market cap rankings.
Whale Activity All Over. Time For Another Bullish Ride?
PEPE bullish journey has mainly been controlled by huge buying activities from the crypto whales and investment firms. For instance the venture capital firm Nascent recently acquired 447.67 billion PEPE tokens from Binance for about $5.85 million making PEPE the largest asset in Nascent portfolio and surpassing holdings in other major assets like Maker (MKR/USD) and Tether (USDT).
Nascent(@nascentxyz) bought 447.67B $PEPE ($5.85M) after the $PEPE price dropped.https://t.co/xqW0EhCNEj pic.twitter.com/sbiNBOrWya
— Lookonchain (@lookonchain) June 8, 2024
Another noteworthy transaction involved an unidentified investor purchasing 231.64 billion PEPE tokens for approximately $2.9 million from Kraken.
These acquisitions shows new interest and confidence in PEPE even as its price has retreated 31% from its all-time high of $0.00001725 reached on May 27th. This buying trend signals a potentially favorable setup for PEPE price, should market sentiment remain positive or improve.
PEPE Technical Analysis
PEPE recent price action shows a picture of strength and potential upside at the current level. Despite a notable pullback of over 30% since its highest reading in late May, the meme coin continues to trade within an ascending parallel channel in place since April 13th. The price has retraced to this channel lower support for a couple of days now and price is at a level that could determine its short term trajectory.
The daily Relative Strength Index (RSI) stands at 43 reflecting the bearish momentum as the market attempts to find stability after the overbought conditions recorded on May 27 when the RSI reached 77. Also the Moving Average Convergence Divergence (MACD) show a bearish crossover happened on June 1st with the MACD line falling below the signal line, confirming further the bearish market sentiment in the short term
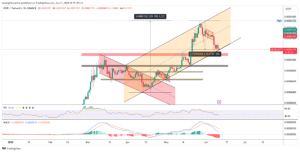

PEPE Price Chart: TradingView
Looking ahead if whales and bullish traders effectively defend the current support level then PEPE could retest its recent all-time high at $0.00001725. A successful defense and subsequent bullish momentum might even break the resistance of the existing parallel channel and establishing new highs. On the other hand failure to hold these levels could see PEPE price fall towards the $0.00000900 support.
PEPE ability to maintain high trading volumes and attract significant whale transactions during market downturns positions it as a meme coin with both popularity and potential for recovery soon.


