


The PEPE coin has been on the decline in today’s trading session, opening at $0000001472 before declining. The 24-hour chart displays a sequence of changes, which include the price dropping to $000000143 in the middle of the day. This pattern depicts a bearish trend where the coin is failing to recover to the previous high.
Resistance was especially seen at $0.000001470 as PEPE could not hold gains and was tested at this level multiple times in the day. On the flip side, the coin found some level of support around $0.000001420, this could indicate a possible stabilization zone if the bear pressure persists.
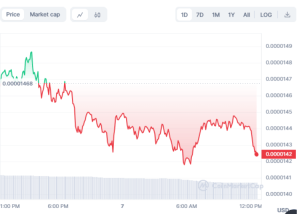

PEPE/USD 24-hour price chart (source: CoinMarketCap)
Furthermore, the trading volume of PEPE has slightly dropped and is now at $882. 52 million, which is a 31.14% fall. This decline in activity also came with a decline in the market capitalization that dropped by 2.97% to $597 billion. This general decline in trading volume might be an indication of the fact that investors are treading carefully in the present market environment.
PEPE/USD Technical Analysis
From the MACD analysis of PEPE, it is clear that the indicator is in close proximity to the signal line, and the recent values show that there is a small difference between the two lines. At the time of writing, the MACD line (blue) is only marginally below the signal line (orange) at -0.0000002765 as opposed to the signal’s -0.00000010387, signifying bearish pressure.
However, the fact that both lines are close together indicates that volatility is low, and it is possible that a crossover is near. In such a case, if the MACD line crosses above the signal line, it will suggest a bullish trend.
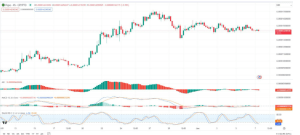

PEPE/USD 4-hr Price Chart: (Source: Trading View)
As of the time of writing this analysis, the Stochastic RSI for PEPE is in the process of going in the oversold zone with a reading of 10.28 on the 4-hour chart. As it is revealed by the indicator, PEPE is at a point below the oversold level, meaning that if demand rises, it is a good time to buy.
Adding to the above evidence, the AO, a momentum indicator, is also negative at the moment, placed at -0.000000238095. This is demonstrated by the fact that the bars are red, indicating that the market is under bear pressure. If these bars begin to narrow, this may be an indication that bearish activity is weakening and bullish activity is starting to build.


