


BONK has been on a great surge in recent weeks and has proven that it’s not just an average memecoin. According to Coinmarketcap data, in the last 24 hours, BONK’s price has surged by 5.08% to read at $0.00003839, while its 7-day and 30-day gains stand at 23.17% and 41.96%, respectively, as of press time. With a market capitalization of $2,528,321,092, BONK now ranks as the 47th largest cryptocurrency by market cap.
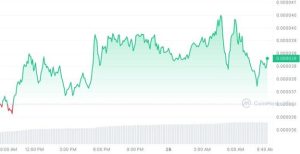

BONK Price Chart: Coinmarketcap
The most interesting thing is that BONK’s trading volume has increased by 106.36% in the past 24 hours, reaching $960 million. This increase in trading activity is a clear indication of the immense interest and bullish sentiment surrounding this memecoin.
Whats Behind This Rally, Though?
One of the key factors driving BONK’s ascent is Coinbase’s recent announcement that it will list perpetual futures contracts for Shiba Inu, BONK, and Floki Inu on its international exchange and Coinbase Advanced platforms. This highly anticipated listing, slated for May 30th, has significantly boosted BONK’s credibility and accessibility, fueling bullish sentiment among investors. The parent coinbase listing happened on Dec 13th, 2023.
@CoinbaseIntExch will add support for Bonk, FLOKI, and Shiba Inu perpetual futures on Coinbase International Exchange and Coinbase Advanced. The opening of 1000BONK-PERP, 1000FLOKI-PERP, and 1000SHIB-PERP markets will begin on or after 9:30am UTC 30 MAY 2024. $BONK $FLOKI $SHIB pic.twitter.com/TNNAFEjtHH
— Coinbase International Exchange 🛡️ (@CoinbaseIntExch) May 23, 2024
Also, BONK’s success is intertwined with the performance of the Solana blockchain on which it operates. Recent upgrades and improvements to the Solana network have enhanced BONK’s functionality and performance, attracting more users and investors to this ecosystem.
What Does BONK Technicals Suggest?
BONK’s price action has been nothing short of remarkable, with the crypto asset breaking out and closing above a key resistance zone at 0.00003672, as indicated in our previous analysis, Flipping it into a crucial support level in the last 24 hours. Today’s daily candlestick chart shows a bearish attempt to retest this newly formed support, but bullish momentum is intensifying. BONK also broke out of a bullish pennant pattern on May 20th, a continuation pattern that suggests further upside potential. These multiple breakouts have set the stage for a potential new all-time high in the near future.
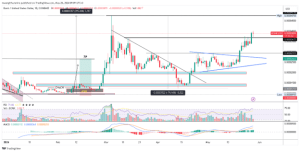

BONKUSD Daily Chart: TradingView
Several key metrics support the likelihood of BONK reaching new all-time highs. The high long/short ratio chart indicates a surge in long positions over short positions in the last 24 hours, reflecting bullish sentiment among traders.
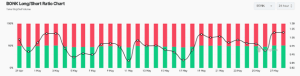

BONK Long/Short Ratio: Coinglass
Also, the growing Futures Open Interest (USD) suggests that new money is flowing into the BONK market, potentially sustaining the current uptrend. Interestingly, it has recorded the highest mark ever, currently slightly above the $22 million mark.
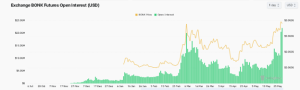

BONK Futures Open Interest: Coinglass
On the technical indicators present in our trading view chart above, the daily Relative Strength Index (RSI) stands at a bullish 71, indicating strong buying pressure and entry into an overbought region, which may likely face correction in the short term to ease the reading to a more neutral mark. The Moving Average Convergence Divergence (MACD) indicator is also firmly in bullish territory, with the MACD line above the signal line and well-separated from the zero neutral line, signaling strong bullish momentum.
With such compelling indicators and the impending Coinbase perpetuals listing, analysts predict that BONK has the potential to deliver a staggering 100x return in the near future, presenting an enticing opportunity for investors seeking substantial gains.


