


Bonk (BONK) is making headlines once again as it gears up for potentially reaching a new all-time high. After a remarkable rally earlier this year, Bonk has caught the attention of traders, thanks to its recent bullish patterns and strategic price movements.
Bonk’s journey has seen significant highs and sharp lows. The crypto experienced an exceptional surge of 395% in early March, catapulting its value to an all-time high of $0.00004750, up from a February low of $0.00000950. However, this peak was followed by a 74% correction, with the price stabilizing at a low of $0.00001234 by mid-April. Despite these fluctuations, Bonk has shown resilience and is currently priced at $0.00003383 zones, reflecting a 3.23% increase over the last 24 hours and an impressive 41% rise over the last 7 days.
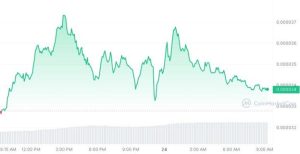

BONK Price Chart: Coinmarketcap
Bonk holds a substantial market cap of over $2.26 billion while the trading volume in the last 24 hours has seen a significant uptick, recording a surge of 77% to reach $1.19 billion. These metrics not only highlight the growing interest in Bonk but also hint at its potential for further gains.
Is a Breakout Possible Soon?
From a technical standpoint, Bonk’s recent price action is particularly noteworthy. On May 20th, Bonk’s price broke out from a bullish pennant on the daily chart—a bullish continuation pattern that indicates potential upward momentum. This breakout is crucial as it positions Bonk closer to challenging and possibly surpassing the critical resistance zone at $0.00003672.
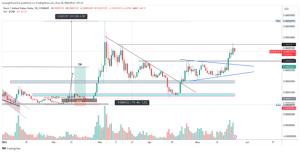

BONK Daily Chart: TradingView
For Bonk to set a new all-time high, it must successfully close above this resistance level, having already converted the previous resistance of $0.00002929 into a support level. However, the road ahead is challenging. Bonk faced rejection at the $0.00003672 resistance zone and is showing bearish signs today. There is a possibility of further retracement down to the $0.00002929 level before another upward attempt can be made.
Two key technical indicators provide a mixed yet optimistic outlook. But also, one key metric shows bull momentum. The Open Interest-Weighted Funding Rate is positive, reflecting a bullish sentiment among traders.
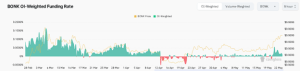
BONK OI-Weighted Funding Rate: Coinglass

Meanwhile, the Relative Strength Index (RSI) is at 67, suggesting a strong momentum but nearing overbought conditions which could lead to a temporary pullback. Additionally, the Moving Average Convergence Divergence (MACD) is positive, with the MACD line having crossed above the signal line, an indicator of increasing bullish momentum.
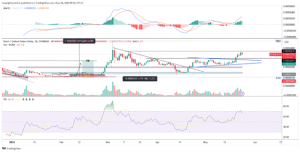
BONK 1-Day Indicator Chart: TradingView
Looking ahead, experts and predictive analytics have positive views on Bonk’s future. CryptoDisrupt, a leading cryptocurrency news website, predicts that Bonk’s price could oscillate between $0.000020 and $0.000024 by 2024, with an average expected price of $0.000021. For 2025, projections from CoinMarketcap suggest a potential high of $0.000036, with an average price around $0.000031 and a possible low of $0.000030, depending on market conditions.


