


Bitcoin started the day at approximately $67,730 and faced some early downward pressure, dipping further during the morning hours. The sentiment shifted positively around midday, fostering a solid recovery. By late morning, Bitcoin embarked on a bullish rally, pushing its price up 2% to a peak of $69,149 by press time.
In the past week, Bitcoin’s price experienced volatility, repeatedly testing the resistance level at approximately $68,500. Recent trading sessions, however, show Bitcoin breaking through this barrier, with the price currently peaking near $69,130. Additional resistance points may loom around the $70,000 mark, indicating potential challenges ahead.
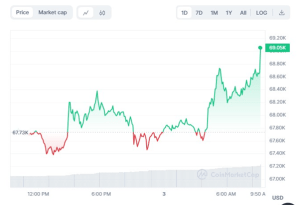

BTC/USD 24-hour price chart (source: CoinMarketCap)
On the other hand, Bitcoin has seen a surge in trading activity, with a dramatic 98.75% increase in 24-hour trading volume, now reaching $22.17 billion. This upsurge in volume coincides with an overall rise in market capitalization, which has climbed by 1.92% to approximately $1.36 trillion. This recent spike in both trading volume and market cap suggests heightened investor interest and market liquidity, potentially signaling an optimistic outlook among traders.
BTC/USD Technical Analysis
The RSI (Relative Strength Index) indicator suggests increasing momentum in Bitcoin’s price movement. Currently, the RSI stands at 63.02, indicating that Bitcoin is approaching overbought territory but is not yet at a critical level. This rise in the RSI aligns with the recent price surge, pointing to stronger buying activity in the market.
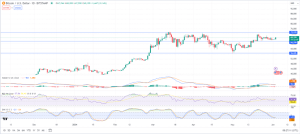

BTC/USD 24-hour price chart (source: TradingView)
If the RSI continues to climb past 70, it may signal an overbought condition, prompting traders to anticipate a potential pullback or consolidation in price.
Additionally, the MACD (Moving Average Convergence Divergence) indicator for Bitcoin is currently showing signs of bullish momentum, as observed in the recent shift where the MACD line (blue) has crossed above the signal line (orange).
This cross typically suggests increasing upward momentum and might be a signal for potential buyers that stronger market gains could be anticipated. The histogram, reflecting the difference between the MACD and its signal line, has moved into positive territory, further supporting the bullish signal depicted by this technical indicator.
The Stochastic Momentum Index (SMI) for Bitcoin is also signaling an upturn in momentum. The SMI line has recently crossed above the signal line and is rising sharply towards positive territory, indicating increasing bullish momentum. Currently positioned at 29 and moving upwards, this positive shift suggests that the buying pressure is strengthening, which could be predictive of further upward price movements if the trend continues.


