


Bitcoin (BTC) was seen trading with comparatively low volatility today and oscillating between $67,800 and $68,320. 43 mar.Nevertheless, this comes with mixed emotions among most participants in the broader cryptocurrency market. This slight slide from the high of near $68,790 back to $67,953 shows a more careful approach to trade,especially since there are US inflation numbers coming up that can affect the Fed’s rate decisions. This upcoming data is important as they might lead to a reconsideration of the allocation of the assets by investors thus influencing the price changes of Bitcoin.
Effects of Economic Indicators on Bitcoin
The market conditions of Bitcoin are not independent anymore from the larger macroeconomic framework. New data on the US economy, including jobless claims and home sales, remain volatile, which also helps to introduce uncertainty.
For instance, the U. S. initial jobless claims which represent one of the most followed indicators mildly disappointed market expectation suggesting that perhaps the labor market is not as robust as most analysts have made it to be.
In addition, the decline in pending home sales was much sharper than predicted, and also signified weakening in the housing sector that could potentially translate to weaker consumer demand and sluggish movement generally in the economy. These factors are important as they help in explaining the oscillation of BTC within the designated trading range.
On the technical front, Bitcoin is on a clearly defined path with an ascending channel on the daily time-frame, therefore signifying a steady, controlled bull run. In case the Bitcoin maintains its position above $67,000, a possibility of reaching $71,423 is realistic, and the upward trend might continue and get to the $74,715.
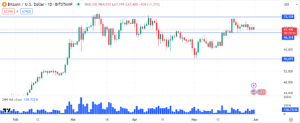

On the other hand, a break below might lead it back to lower supports at the $65,064 or $61,530 levels depending with how the market reacts to the upcoming economic data.
Bitcoin Consolidates: Finding the Balance in the Small Range of $66 000-$68 000.
On the 4-hour chart, BTC/USD is still is a phase of consolidation with the pair now trading at around $67,800. The Relative Strength Index (RSI) in this position is slightly below the midpoint at roughly 45. 35; that is, the buying and selling pressure is almost equal.
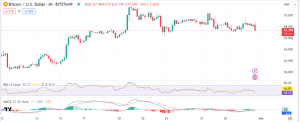

Currently, the Moving Average Convergence Divergence (MACD) is a little below the signal line and almost crosses the zero line, which indicates a bearish pressure. Bitcoin has been trading in the range and facing resistance close to $68,000 and support price around $66,000. This sideways trading pattern is a sign that the traders are waiting for the significant news or economic releases to be announced.


