


The price of XRP has been in a bearish phase over the past 24 hours, indicating a gradual downward trend. Starting at around $0.5064, the price faced an immediate dip, followed by a peak at approximately $0.5100. However, this spike was short-lived as the price began to exhibit a series of lower highs and lower lows, signaling a bearish momentum.
Throughout the day, XRP’s price fluctuated, ultimately declining to just below $0.5000 before a slight recovery. The recovery did not hold, and the trend continued downward, with the lowest price touching around $0.4985, where support was established. At press time, XRP was exchanging hands at $0.5006, a 1.07% decline from the intra-day high.
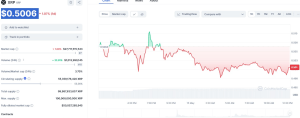

Trading volume increased by 25.65%, indicating strong market activity. Despite this, the price action suggests that the increase in volume could be attributed to selling pressure. The volume-to-market cap ratio stands at 3.70%, emphasizing active trading during the day.
The bearish trend in XRP’s price is characterized by key resistance, which was briefly tested at around $0.5100, and support levels forming just below the $0.500 mark.
Legal Developments and Market Impact
XRP’s recent price movements have also been influenced by ongoing legal developments. On May 13, Ripple’s CFO submitted a declaration supporting the company’s request to conceal specific details in court documents related to the SEC lawsuit. This action coincides with a significant transaction of 280 million XRP tokens between Ripple and an unnamed centralized exchange.
#XRPCommunity #SECGov v. #Ripple #XRP @Ripple has filed a Motion to Seal Certain Documents filed in connection with the @SECGov‘s Motion for Judgment and Remedies.
https://t.co/BCeLaHOnw0— James K. Filan 🇺🇸🇮🇪 (@FilanLaw) May 14, 2024
Legal expert James K. Filan highlighted this development as Ripple urged Judge Torres to approve their motion to seal parts of the SEC’s Motion for Judgment and Remedies. The XRP market reacted positively to these updates, showing a notable increase in price, although this was not enough to sustain a bullish trend.
Technical Analysis: Indicators Point to Bearish Momentum
Technical indicators suggest that XRP’s market activity is currently experiencing noticeable fluctuations, with a possibility of surpassing the $0.55 resistance level soon. However, the Moving Average Convergence Divergence (MACD) is slightly negative, indicating that the bearish momentum might continue in the near term. The Relative Strength Index (RSI) stands at 41.50, below the neutral 50 mark, hinting at continued bearish momentum.
The Bollinger Bands on the daily chart show that XRP is trading within a relatively tight range, with the upper band positioned at $0.5399 and the lower band at $0.4940. This indicates a period of consolidation, with potential volatility on the horizon
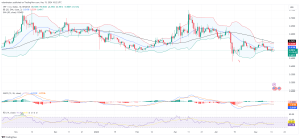

XRP/USD 24-hour price chart (source: TradingView)
If market sentiment turns negative, XRP’s value could stabilize around $0.45, with a further decline potentially reducing its price to about $0.4. Conversely, if the bullish momentum picks up, XRP might approach $0.75 and potentially hit the $1 mark in the near future.
However, for XRP to initiate a significant upside, it must clear the 50-day simple moving average (SMA) and the $0.570 resistance level. A close above this level could increase the chances of a rally, potentially testing the $0.620 resistance


