


The cryptocurrency market witnessed a significant downturn, with XRP experiencing a substantial 5% decline in its price. As the bullish trend subsides, investors and traders are examining this decline in greater detail while also considering what it may mean for XRP’s future price action.
As of now, the price for XRP stands at $0.5742, having dropped by 5.62% over the past day. This price decrease is a more significant bearish trend from around $0.6084 to its current levels.
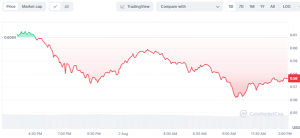

This decline is noticeable in the trading volume as it has decreased by 9.63 percent compared to the previous day signalling a possible weakening selling pressure yet there seems to be little demand from sellers showing conservative investor sentiment.The decrease in market cap by 5.72% aligns with the bearish sentiment prevailing in the market.
Support and Resistance Levels
Looking at the chart, we can see that XRP’s current price lies near a potential support level, and also immediate resistance can be observed close to the $0.60 mark . The price had previously consolidated at this level before resuming its downtrend. Further declines may occur if this support line breaks downwards towards $0.55 range.
Market analysts have observed that XRP’s long-standing consolidation phase inside a symmetrical triangle pattern might point towards an upcoming move. Such formations historically suggest major breakouts either upward or downward direction soon after formation completion takes place.
Fibonacci retracement levels based on the 0.382 level indicate immediate resistance at $0.9038, which is crucial for determining where XRP will go next if breached successfully, then higher rallies may ensue with another strong barrier sitting at $1.4856.
Market Sentiment and Investor Reactions
Ripple’s ongoing legal battles with SEC regulators have led to market uncertainty, but hopes of a favourable ruling combined with unlocked securement worth about 297 million dollars worth 500 million XRPs have triggered bullish predictions.
🚨 🚨 🚨 🚨 🚨 🚨 🚨 🚨 🚨 🚨 500,000,000 #XRP (291,388,407 USD) transferred from unknown wallet to #Ripplehttps://t.co/uufD8ieOuV
— Whale Alert (@whale_alert) August 1, 2024
But despite challenges facing its way, there is still a large community supporting XSP.A lot of on-chain activity and high transaction volumes among big investors are some indicators pointing towards recovery. Analysts cite growing network activity beneath short-term price movements as evidence that XRP might rebound again.
Technical Indicators and Future Outlook
Nevertheless, indicators show mixed signals regarding technical positions. XRP relative strength index RSI shows signs suggesting possible corrective actions within few days ahead according to bearish divergence indicating a challenging market environment for XRP.
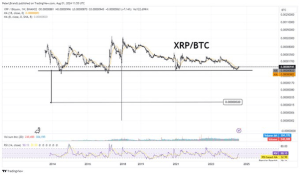

Peter Brandt, a renowned trader, has also noted that there is a risk of a head and shoulders pattern on the XRP/BTC chart. If the critical support level is violated on the XRP/BTC pair, it might lead to a big collapse making investors worried.
However, this is not true for all views as some analysts are hopeful that there could be some sort of recovery. Thereby implying that if market conditions align favorably such as when Parabolic SAR (Stop and Reverse) dots move below a price line then it may restart its bull run again.


