


The bears are returning to the scene as Bitcoin flashes red on Tuesday, as the big crypto trades 0.1% lower on the day. The second largest cryptocurrency by market capitalization, Ether, is flashing green, up 0.42% over the last 24 hours.
Other top-cap cryptos, such as Ripple’s XRP and Toncoin (TON), had posted 0.5% gains and 2.6% losses, respectively, over the last 24 hours.
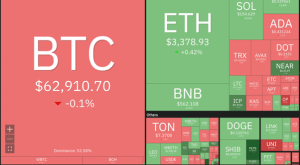

24-hour performance of top cryptocurrencies. Source: Coin360
The wider crypto market was still showing signs of recovery, up 0.31% over the last 24 hours to rest at $2.31 trillion.
Could altcoins start a rebound in the next few days and initiate an altcoin season? Let’s analyze the charts of XRP and Toncoin to find out.
XRP price analysis
The XRP price rose above the 50-day exponential moving average (EMA) at $0.4882 on July 13 and followed that up with a sharp up move to $0.57 on July 15.
The bears are defending the $0.57 level, but a positive sign is that the bulls have not allowed the price to dip below the psychological level of $0.50 for the last three days. If the price rebounds off $0.50, the likelihood of a rally above $0.57 increases. The international payments token could then rise to $0.6 and eventually to the November 14 range high at $0.7471.
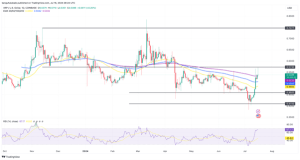

XRP/USD daily chart. Source: TradingView
The relative strength index (RSI) at 67, suggested that the bulls were in control of the price supporting the bullish outlook.
Contrarily, if the price turns down and produces a daily candlestick close below $0.50, it will signal that the pair may drop to the solid support at $0.46 and later to the $0.41..
Toncoin price analysis
Toncoin (TON) has been seesawing between $6.77 and $8.29 for the past few days, indicating that the investors were buying on dips and selling on rallies.
At the time of writing, bulls were fighting to keep the price above at $7.19, which provided the immediate support for the token.
The 50-day EMA is flattened out, and the RSI is near the midpoint at 49, indicating a balance between supply and demand.
If TON moves in favour of the buyers, they could drive the price above $7.5, the TON price could rally to $8.29. This would represent a 12% uptick from the current price.
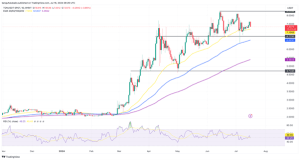
TON/USD daily chart. Source: TradingView
On the other hand, if the price turns down sharply from $7.33, it will signal that the bears are selling on rallies. The pair could then slide toward the support of the range at $6.77. The next logical move would likely be to begin on a break below $6.77.


