


Worldcoin (WLD) price has been on a sharp decline in the last 24 hours after failing to breach the intra-day high of $3.03. This dip is attributable to the crypto market downturn, as seen in the 3.58% decline in the total crypto market capitalization to $2.27 Trillion. At press time, WLD was changing hands at $2.73, a 9.26% decline from the intra-day high.
During this bear rally, WLD’s market capitalization declined by 8.70% to $687.42M, while the 24-hour trading volume surged by 8% to $136.48M. This surge in the trading volume during a decline reflects tha “buy the dip strategy” as traders take advantage of the price pullback. Concurrently, this decline has been felt in the last 7 and 30 days, with WLD prices down 17% and 41%, respectively.
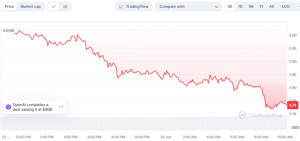

WLD/USD 24-hour price chart (source: CoinMarketCap)
If this bearish pressure persists and the intra-day low of $2.71 is breached, the next support levels to watch out for are $2.60 and $2.50, respectively. However, if the bulls manage to outperform the bears, a reversal would need to reclaim and breach the $3 resistance for a continued rally.
However, the increasing trading volume is attributed to the optimism brought about by recent regulatory endeavors. According to a recent report, Worldcoin is re-instating in regions where it was prohibited after a long battle with investigations. Kenya, for instance, is returning the operations after the Kenya Criminal Investigations team, DCI, affirming that the entity has not violated privacy laws or endangered state security.
Concurrently, Woeldcoin is expanding to Ecuador after 90 days of scrutiny on its operations set in March this year.
WLD/USD Technical Analysis
On the WLDUSD 1-day price chart, the bearish momentum is wearing out. The Bollinger Bands trend south suggests that volatility is declining, a precursor of waning selling pressure. The upper, middle, and lower bands touch at $4.9, $3.5, and $2.2, respectively. With the price action nearing the lower band, a rebound may be witnessed touching the middle band at$3.5.
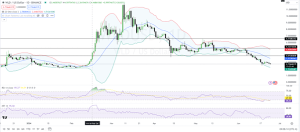

WLD/USD price chart(source: TradingView)
Moreover, the Relative Strength Index (RSI) is oversold, with a rating of 25 and moving below its signal line. This trend suggests that the selling pressure in the market is nearing an end. A move of the RSI above the middle line would confirm a bullish reversal.
Adding to the bullish sentiment, the Money Flow Index (MFI) is trending upwards after dipping to a low of 12. This MFI trend suggests that bulls are buying the lows, and since the money influx is increasing with the rating at 28, a bullish reversal may be imminent.


