


The crypto market today shows a period of resurgence as top cryptocurrencies are painting the charts green. Bitcoin has spearheaded this rally, noting a significant uptick of 3.29%, signalling potential continued growth. The premier cryptocurrency saw a dip below $63,000 but has bounced back, breaking past the $65,000 resistance level and is now nudging the $67,500 mark.
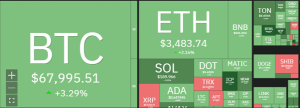

This resurgence is pivotal as it climbs towards the significant $68,000 barrier, which, if crossed, could clear the path toward a higher resistance level at $73.7K, and perhaps aim for the much-anticipated $95.5K target.
Ethereum follows Bitcoin’s lead with a gain of 2.13%, which has further buoyed the broader market, including smaller coins and DeFi projects. With a 24-hour volume surge of 18.81% totaling $83.54B, the market capitalization has reached $2.56 trillion.
An active rally over the last three days has kept the momentum alive, spurred by Bitcoin’s ascent from the crucial 61.8% Fibonacci retracement level. The correction from recent highs has moderated the overbought conditions, creating a more favourable entry point for potential investors.


Ethereum’s price dynamics mimic the general market’s optimism, recuperating from a slide to regain its stance above $3,500. The second-largest cryptocurrency by market cap has displayed resilience, as seen in its 24-hour trading volume of $13.65 billion, which reflects a confident 5.25% recovery in value.
Altcoin Market Performance
The altcoin sector is not far behind, with Toncoin (TON), Internet Computer (ICP), and Fantom (FTM) registering impressive weekly gains. TON is particularly noteworthy with a 35% weekly surge,according to CoinMarketCap’s data.However, altcoins like DOGE, SHIB and ADA have their prices stuck downward, despite the broad-based market rebound.
SHIB/USD 4-hour Analysis: SHIB Trades Within a Tight Range with Key Levels to Watch
Shiba Inu (SHIB) presents a cautious market posture on the 4-hour chart, oscillating within a confined range. The asset encountered resistance at the $0.00003245 mark, forming two distinct peaks that suggest a potential double-top pattern, an indicator that could signal a reversal if confirmed.


The subsequent support levels are notably highlighted at $0.00003117 (Bottom 1) and $0.00003077 (Bottom 2), with Bottom 2 serving as a more definitive baseline for the current trading phase. SHIB is currently trading just above this level, which aligns with the Relative Strength Index (RSI) lingering near the midpoint at around 50, suggesting neither overbought nor oversold conditions.
The Bull Bear Power (BBP) indicator shows a slight negative value, hinting at bears having a marginal advantage. If SHIB breaks the support at Bottom 2, it could head towards the lower target near $0.00002255, whereas a move above the recent tops could aim for the bullish target indicated on the chart.
DOGE/USD Daily Analysis: Indicators Suggest Consolidation with Upside Potential
Dogecoin (DOGE) is exhibiting a period of consolidation on the daily chart as it attempts to establish direction. The Relative Strength Index (RSI) is slightly above neutral at 59.14, suggesting modest buying momentum without venturing into overbought territory.
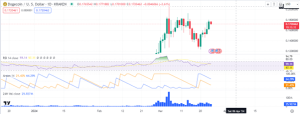

The Aroon indicator tells a more nuanced story, with Aroon Up (blue) crossing above the Aroon Down (orange), indicating that the bullish trend is gaining traction, albeit with caution as the values are not at extremes. Trading volume remains relatively steady, showing neither a significant pick-up in interest nor a decline.
The latest price action has DOGE hovering around the $0.172 mark, facing immediate resistance near the recent high at approximately $0.177. If Dogecoin breaks past this resistance, it could signal an uptrend continuation. Conversely, failure to move above this level could see the cryptocurrency testing support levels, potentially retracing to around $0.170 or lower if the bearish pressure increases.
ADA/USD Daily Chart Analysis: ADA Trades at a Critical Juncture
Cardano’s (ADA) price action on the daily chart shows a testing phase as it wavers around the $0.643709 price mark. The Relative Strength Index (RSI) hovers around the 54.50 level, suggesting a neutral momentum without clear directional bias.
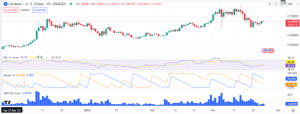

Meanwhile, the Aroon indicator shows the Aroon Up (blue line) above the Aroon Down (orange line), indicating the potential for an uptrend even though the current pattern does not signify a strong momentum. Trading volumes have seen a dip compared to the peaks earlier in the month, reflecting a decrease in trader activity.
The current ADA resistance level near the $0.70 region has capped the upside for ADA, while on the downside, the market is watching closely for support around the $0.55 area, a level that previously acted as a springboard for price rebounds. As the market consolidates, ADA traders will be looking for a decisive move either to reclaim higher levels or to test the resilience of the current support zones.
The rise in altcoin prices across the board is a strong indicator of a broad-based market recovery, suggesting an increase in investor appetite for riskier assets. With the market cap standing strong at $2.56 trillion, the crypto space is gearing up for a potentially transformative period ahead.


