


The TON price is trading at $6 as of 6:00 am EST, up 6.4% over the last 24 hours.
Toncoin is outperforming the market which remains unchanged at $2.3 trillion. As other top-cap cryptocurrencies are recording mild gains, TON is leading the gains as shown in the figure below. The only other top-cap altcoins with notable gains on May 10 are BNB Chain’s (BNB) and Solana (SOL) which are up 1.30% and 3.38% respectively.


Performance of top-cap cryptocurrencies. Source: CoinMarketCap.
The total value locked on Toncoin has also been increasing tremendously over the past three months, signalling a growing developer interest in the Telegram payments token.
The TON price has benefited from the recent upward momentum seen in the broader crypto market.
More importantly, the health, growth rate, and sustainability of the project ecosystem are also highlighted by changes in the data obtained.
According to CoinMarketCap data, Toncon’s trading volume increased by approximately 3954% over three months, surpassing $890 million in mid-April.
Data from blockchain data analytics firm DefiLlama shows that Toncoin’s total value locked (TVL) has increased over the last three months, rising more than 1070% from $17.8 million at the beginning of February to the current value of $217 million.
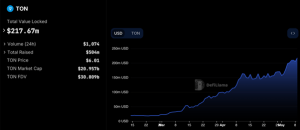

Toncoin total value locked. Source: DefiLlama
Is Toncoin’s V-shaped recovery flag a hint of what is to come?
TON price pulled back after reaching an all-time high of $7.65 on April 11 as sellers booked profits and the wider crypto market corrected.
The layer 1 token has since recovered from the dips at $4.5 to the current levels.
Due to this price action, a V-shaped recovery chart pattern can be seen on the daily chart, which hints at the continuation of the uptrend.
Bulls have pushed the price above the 20-day exponential moving average (EMA) currently at $5.7, signalling the ability of the buyers to sustain the uptrend. This projected an uptick to the neckline of the governing chart pattern at $7.40. Such a move would represent a 24% ascent from the current price.
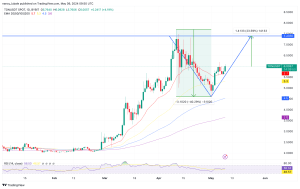

TON/USD daily chart. Source: TradingView
The 50-day exponential moving average (EMA), the 100-day EMA, the 200-day EMA and the relative strength index (RSI) were all facing upward, suggesting that the market conditions still favored the upside. The price strength at 56 indicated that the bulls still dominated the market.
On the other hand, the bears may pull the price lower with the 50-day EMA at $5.3 providing the first line of defense. Additional support lines could emerge from the psychological level at $5.0 and the support zone between $3.6 and $4.5, where the 100-day and 200-day EMAs lie.


