


In the past 24 hours, Toncoin’s price has showcased notable volatility. Starting at a low of $5.10, the cryptocurrency has since seen a modest rise, marking the onset of a brief upward trend from its earlier position. During this timeframe, trading activity has remained robust, with the trading volume reaching $176.24 million.
TON price analysis shows the cryptocurrency rally above $5.1445 has however seen a drop in network interaction, as indicated by the diminishing number of active addresses, may hint at a cooling off of user interest in the short term. This could potentially affect demand for Toncoin has exhibited resilience with a slight decline of 0.71% in the past day.
TON Coin Continues Above $5.0 Despite Dearish Winds
TON/USD 4-hour chart analysis reveals that Toncoin is trading at $5.13, experiencing a minor downtrend from its recent high of $5.35. The Keltner Channel indicators show that the price is hovering just above the middle line, which stands at $5.09, suggesting a slight bullish bias within the channel range. However, the recent price has dipped below the recent peak of $5.35, signaling some selling pressure.
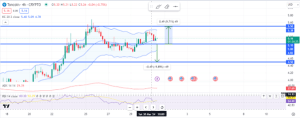

The ADX (Average Directional Index) is at a value of 29.35, indicating a somewhat strong trend, though not exceptionally robust, given that values above 25 are generally considered to signify a strong trend. The RSI (Relative Strength Index) is currently at 53.79, which points to a relatively balanced market without excessive buying or selling pressure at this time.
Considering the modest pullback and the technical indicators, investors might expect TON to test the support at the lower Keltner Channel line, around $4.78, if the downward momentum persists. Conversely, a push above the current 4-hour closing could see resistance near the recent high of $5.31.
Toncoin (TONCOIN) Ascends Toward Resistance with Support in Check
Toncoin’s price trajectory on the 2-hour timeframe shows a clear uptrend, as demonstrated by the pattern of escalating peaks and troughs following a phase of lateral movement. The ascent is marked by an active push for higher values, confirming the bullish momentum that has taken hold after a period of price stabilization.


The chart showcases an immediate support level at the $3.24 mark, a figure that aligns with the 50/200 Simple Moving Average (SMA) and acts as a critical point of return for the price dips. This particular convergence of the SMA and price action bestows a significant technical support role to this level. Below this, a secondary support point looms at the $2.47 threshold, offering another potential cushion should the price experience a more pronounced retreat.
On the resistance front, Toncoin faces an immediate ceiling at the recent high of about $5.67. This is the pinnacle of the recent price surge before a minor fallback occurred. Breaching this barrier could see Toncoin approach the round number resistance of $6.00, a level often regarded as a psychological impediment in trading landscapes.
Indicator analysis lends additional depth to the picture: The Stochastic RSI is signaling a possible upcoming price plateau or pullback, given its overbought status due to a recent crossover in the upper region. Meanwhile, the Aroon indicator underscores the current trend’s vigor, with the Aroon Up line at 57.14% and the Aroon Down at an absolute zero, painting a picture of robust bullish impetus.
Toncoin price analysis shows Toncoin in a bullish light, marked by an uptrend that is approaching a key resistance with well-established support levels. Although indicators hint at a potential pause in the ascent, the overall momentum remains strongly positive.


