


The crypto market was flashing red on May 24 following approval of spot Ethereum ETFs in the U.S. on May 23, with most top-cap cryptocurrencies rising by as much as 5%.
Solana (SOL) dropped the most with 7% from an opening of $176 on May 24 to an intra-day low of $165. The largest cryptocurrency by market capitalization Bitcoin has dropped 3.5% over the last 24 hours to trade at $67,029, while Ether (ETH) declined by a smilar percentage, up 3.5% to exchange hands $3,658, according to data from Coin360. This performance took Bitcoin’s dominance to 51.77%.
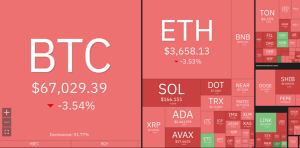

Cryptocurrency 24-hour performance. Source: Coin360
The global crypto market capitalization has dropped by 3.75% over the last 24 hours to $2.5 trillion, according to data from CoinMarketCap.
Apart from Solana, other top-cap tokens within the Solana ecosystem were witnessing a correction. Render (RNDR) saw approximately 6% losses over the last 24 hours to $9.95. The most notable correction was witnessed by Arweave (AR) holders which had dropped by 10%.
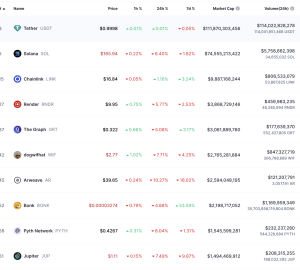

Top Solana-based token performance. Source: CoinMarketCap
Leveraged liquidations drive crypto prices higher
The drop in the prices of major cryptocurrencies has led to a rush of liquidations across the derivatives market. Long derivatives traders appear to have been caught off guard, leading to a quick spat of leveraged liquidations.
In the past 24 hours, over $390 million in crypto positions had been liquidated across the crypto market, with $201 million wiped out in the last 12 hours. Of these, $295.1 million were long liquidations. $57.97 million long SOL positions have been liquidated over the past 24 hours, according to data from Coinglass.
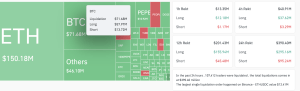

Crypto market liquidations. Source: Coinglass
Over 107,412 traders were liquidated, with the largest single liquidation being ETH/USDC on Binance, valued at $12.41 million.
Solana’s market setup points to more losses
The SOL price action has formed an ascending parallel channel chart pattern on the daily chart, as shown below. The price is now fighting to hold above immediate support from the psychological level at $160.
A daily candlestick close below this level would suggest that deeper corrections are in the picture for the layer 1 token. If this happens, it would clear the way toward the 50-day exponential moving average (EMA) at $156 and later the 100-day EMA at $146 before returning to the major support at $140. Such a move would represent a 15% decline from the current level.
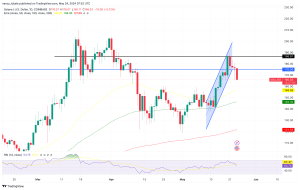

SOL/USD daily chart. Source: TradingView
Apart from the highly bearish technical setup, Solana’s negative outlook was supported by downward-facing RSI and the price strength at 53, down from 69 at the start of the week suggested that the bears had began taking control of the price.
On the upside, a daily candlestick close above$160 would suggest the bulls’ ability to defend this level. In the meantime, the key levels to watch would be arise above the channel’s lower boundary at $175 and the major resistance at $186.


