


Solana (SOL) currently trades at $179.61, marking a decrease of over 5% over the past 24 hours. With a market cap of over $79.73 billion, SOL ranks as the 5th largest cryptocurrency. The 24-hour trading volume stands at $4.97 billion, representing 5.04% of its market cap and positioning SOL as the 6th most traded cryptocurrency.


SOL Data Chart (Source: CoinMarketCap)
With a circulating supply of 443,959,035 SOL out of a total supply of 572,277,365 SOL and no maximum supply limit, SOL exhibits a healthy level of liquidity. Its fully diluted market cap is estimated at $102.78 billion, showcasing its potential market capitalization if all tokens were in circulation.
Weekly Technical Analysis
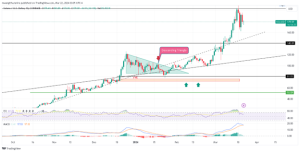
Solana (SOL) has exhibited a bullish trend over the past few weeks, evidenced by three consecutive bullish candlesticks. This upward momentum can be traced back to a previous bullish surge that commenced several weeks ago, initiated by a rejection at the ascending trendline. Since then, SOL’s price has surged, approaching the immediate resistance level. As of the latest data, SOL is trading near the resistance zone at $203.59, encountering resistance after an attempt to breach this level earlier in the week.


SOLUSD Weekly Price Chart (Source: TradingView)
Long-term investors are advised to monitor the weekly close to gauge SOL’s potential trajectory in the long run. A successful breakthrough of the resistance could propel SOL towards testing subsequent resistance levels at approximately $240.57 and $260 levels. On the other side, failure to breach the resistance may prompt a price decline, testing support levels around $140 or the ascending triangle slightly below.
Daily Technical Analysis
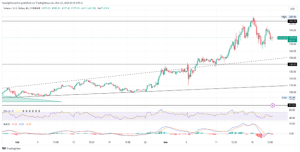
SOL’s daily trading activity reflects its interaction with the resistance zone at $203.59. If bearish sentiment prevails, prices may retreat to test support around $140.89 or the ascending trendline below. Also, sustained bullish momentum could extend the rally, targeting resistance levels at $240 and $260.
SOLUSD Daily Price Chart (Source: TradingView)
As of today’s trading session, SOL opened at $179.41, reaching a high of $181.89 and a low of $173.90 as of writing. The Relative Strength Index (RSI) stands at 61.30, indicating potential bullish momentum, while the MACD indicator remains positive also as an additional confluence.
4-Hour Technical Analysis
On the 4-hour timeframe, SOL’s price action appears bearish, suggesting a possible retest of immediate support around $166 before a potential continuation of the rally. A breakthrough of this support level could lead to further declines towards the $140 zone.
SOLUSD 4-Hour Price Chart (Source: TradingView)
Also, a rejection at the $166 support level may signal a resurgence in buying pressure, potentially propelling prices towards $210 and beyond. The RSI currently sits at 47, hinting at a forthcoming bull run in the short term, despite the MACD indicator residing in negative territory, indicating a short-term bearish trend.
Thoughts Going Forward?
SOL’s technical analysis across different timeframes suggests a dynamic market environment with opportunities for both bulls and bears therefore investors are should keep an eye to closely monitor key and strong support and resistance levels, in confluence with other technicals so as to make informed decisions in navigating SOL’s price movements.


