


The Solana blockchain’s native cryptocurrency SOL has been on a remarkable uptrend in recent weeks, rallying over 6.68% in the last 24 hours alone. At the time of writing, SOL is trading at $196.07 per coin, according to data from CoinMarketCap.
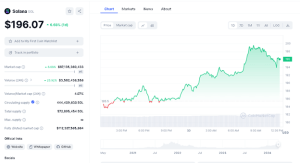

SOL Data Chart (CoinMarketCap)
SOL’s latest price surge has propelled its market capitalization higher to $87.13 billion, cementing its position as the fifth-largest crypto by market cap. The high-throughput blockchain’s trading volume has also spiked 25.92% over the past 24 hours to $3.58 billion as of writing, ranking it as the sixth-most traded cryptocurrency.
Market analysts point to SOL’s volume-to-market cap ratio of 4.07% as a sign of robust trading activity and heightened investor interest in the asset. With 444.4 million SOL in circulating supply out of a total supply of 572.9 million, the cryptocurrency appears to have more upside potential if demand continues to outpace supply on crypto exchanges.
SOL Technical Analysis
Solana’s price charts reveal a bullish outlook across multiple timeframes. On the weekly chart, SOL has formed three massively bullish candlesticks in the last four weeks after finding support at an ascending trendline. Despite last week’s bearish candlestick rejecting prices at resistance near $209, the current week’s candle is trading bullishly and could soon break through this key level.
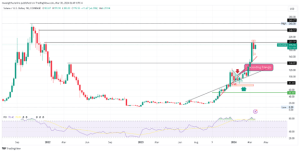

SOLUSD Weekly Price Chart (TradingView)
Should SOL slice through the $209 resistance zone, analysts expect the rally to extend toward the $240 and $260 price targets in the near term. However, with the Relative Strength Index (RSI) showing an overbought reading of 78 on the weekly timeframe, a pullback or consolidation may occur before the uptrend resumes.
Turning to the daily chart, SOL is approaching a second retest of the $209 resistance level, which it faced rejection on March 18th. After the initial rejection, SOL’s price action has been contained within a ranging channel, with the crypto asset now positioned for another test of this crucial zone.
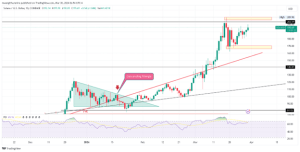
SOLUSD Daily Price Chart (TradingView)
A successful breakout above $209 could open the doors for SOL to rally toward the $240 and $260 resistance levels cited on the weekly chart. On the other side, if the $209 level holds firm as resistance once again, SOL may retrace to test the ranging channel’s support near $170 or the ascending trendline support.
The daily RSI of 65.25 suggests SOL is leaning into overbought territory but has room for further upside before reaching extreme levels. On the 4-hour timeframe, SOL is trading toward the $209 resistance zone of the ranging channel, with immediate support located at $168 zone. The 4-hour RSI reads 62, leaving room for continuation in either direction.


