


Solana (SOL) has been making impressive moves in the cryptocurrency market, recently hitting $194.17, marking an impressive increase of 88.44% over the past month and 4.08% in the past 24 hours. With a market cap of over $86 billion, SOL currently holds the 5th position in terms of market capitalization, reflecting its growing prominence in the crypto space.
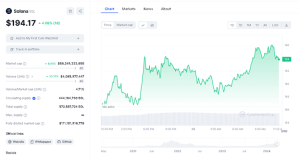

SOL Price Chart (CoinMarketCap)
The 24-hour trading volume has surged by over 30%, reaching over $ 4 billion, showcasing heightened investor interest in SOL. With a circulating supply of 444,185,278 SOL and a total supply of 572,588,272 SOL, Solana’s fundamentals remain strong, contributing to its upward trajectory.
Technical Outlook
In the daily timeframe, SOL is poised for a second attempt to breach the resistance at the $203 level, which it previously tested on March 18, 2024, and encountered a rejection. Despite being amidst a bearish trend post-rejection, bullish sentiment has resurged, propelling SOL towards this critical resistance zone once again. A successful breakout could propel SOL towards retesting resistance levels at $240 and $260, respectively. However, failure to breach the resistance may lead to a retest of support levels, with the dotted ascending trendline and the $140 zone being key areas to watch for potential price rebounds.


SOLUSD Daily Chart (TradingView)
The 4-hour technical outlook indicates that resistance is currently situated between the $200-210 range zone, with immediate support at the $168 zone. The 4-hour Relative Strength Index (RSI) stands at 66.97, reflecting bullish momentum, while the stochastic indicator registers at 86.30, further corroborating the upward trend.
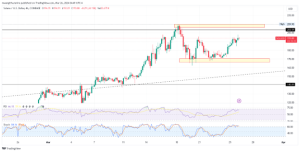
SOLUSD 4-Hour Chart (TradingView)
Technical Indicators
The Relative Strength Index (RSI) and the stochastic oscillator provide valuable insights into Solana’s (SOL) current market dynamics. The daily RSI, standing at 65.25, indicates that the buying pressure is strong and likely to continue driving prices higher.
Meanwhile, the daily stochastic oscillator, registering at 74.04, adds another layer of analysis by suggesting further potential upside for SOL. Also, keep in mind that the asset is overbought, implying that there may be a possible reversal or a pullback in price in the daily timeframe.
Solana Surges on Meme Coin Mania
Solana is witnessing a surge in network activity, driven by the recent meme coin frenzy and price rallies in SOL-based tokens. Key metrics like value moved on-chain, new addresses and active addresses hit near two-year highs on March 22. The Total Value Locked (TVL) on Solana also reached over $4 billion, the highest level since the past 23 months.
🚨 BREAKING BIG: @solana DeFi TVL hits $4.43 billion, reaching a level not seen in 23 months. pic.twitter.com/6V4wBPSKWV
— SolanaFloor | Powered by Step Finance (@SolanaFloor) March 25, 2024
This increased activity can be attributed to users flocking to Solana’s ecosystem to avoid high transaction costs on Ethereum while trading meme coins and politically-themed tokens. Solana’s market cap even broke its all-time high above $82 billion, according to CoinGecko data, further solidifying its position amid the ongoing altcoin and meme coin mania.
Generally, Solana is poised for further gains as it approaches key resistance levels amidst bullish momentum with its technical indicators, which continue to signal bullish sentiment, reinforcing the positive outlook for SOL in the near term. With its strong fundamentals and growing market presence, SOL remains a compelling asset in the cryptocurrency landscape.


