


Solana (SOL) has seen a remarkable uptrend recently, solidifying its position as one of the top cryptocurrencies by market capitalization. Over the last 7 days, SOL has surged by an impressive +30%, according to the latest market data by CoinMarketCap.
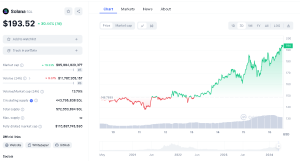

SOL 7-Day Price Chart (Source: CoinMarketCap)
At the time of writing today, March 16th, 2024, SOL was trading at $193.46 zone, reflecting a 10.24% gain over the last 24 hours. This impressive performance has propelled Solana’s market capitalization to a staggering $85.8 billion, securing its rank as the fifth-largest cryptocurrency by market cap.


SOL 1- Day Price Chart (Source: CoinMarketCap)
Trading Volume Paints a Bullish Picture
The trading volume for SOL has also been impressive, reaching over $11.8 billion over the past 24 hours. This places Solana at the sixth position among cryptocurrencies in terms of 24-hour trading volume. Notably, the volume-to-market cap ratio stands at a healthy 13.79%, indicating robust liquidity and investor interest in the asset.
“ So #Solana records its highest daily DEX volume in history, surpassing $3.5 billion “
ATH is not a question of if, but when and I secured us the best position
— Crypto Tony (@CryptoTony__) March 16, 2024
SOL Weekly Technical Analysis: A Bullish Outlook
The technical indicators for SOL point to a bullish picture, suggesting that the rally may have further room to run. SOL’s uptrend over the past week has been remarkable, with the cryptocurrency surging by over 30%. SOL key support levels to monitor sit around the $140 zone and the ascending trendline which acts as a strong support and the next immediate support level if the $140 level is broken.
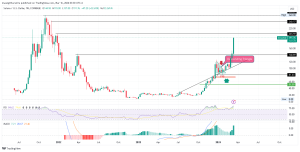

SOLUSD 1- Week Price Chart (Source: TradingView)
Potential resistance levels lie at $203.59, $240.57, and $260.27, levels that could pose challenges for the bulls. The Relative Strength Index (RSI) currently stands at an elevated level of 84.62, suggesting SOL may be overbought in the short term, although assets can remain overbought during strong uptrends.
The Moving Average Convergence Divergence (MACD) indicator stands at 7.21, reflecting bullish momentum. All of these indicators point a bullish picture for SOL.
SOL Daily Technical Analysis
SOL’s bullish momentum shows no signs of slowing down, as the cryptocurrency has closed higher for six consecutive trading days. The recent uptrend has been relentless, with all six daily candlesticks painting a bullish picture. Today, SOL continues its ascent, and it is likely to face resistance at the $203.59 zone. If the bulls manage to break through this level, we could see Solana skyrocketing towards its next crucial resistance level around the $240 zone.
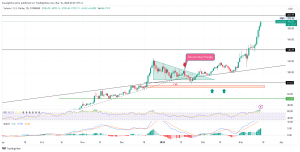
SOLUSD 1- Day Price Chart (Source: TradingView)
However, it’s worth noting that the Relative Strength Index (RSI) currently stands at an elevated level of 88.23, indicating that SOL is in an extremely overbought territory. This could potentially lead to a retracement or consolidation in the near term. Also, the Moving Average Convergence Divergence (MACD) indicator sits at 5.06, reinforcing the bullish momentum but also suggesting caution as the asset becomes increasingly overbought.
Thoughts Going Forward
Solana’s recent performance has been quite impressive and investors should consider exercising caution as the cryptocurrency approaches overbought territories. A potential retracement or consolidation could be on the horizon, as indicated by the elevated RSI and MACD levels. However, if Solana can maintain its bullish momentum and overcome the resistance levels at $203 and $240 zones, further upside could be possible.


