


Solana (SOL) has encountered a notable downturn in the last 24 hours, with its price retreating by 3.78% to trade at $175.53. This slump in value places SOL among the underperformers in a broadly retracting crypto market, which saw a cumulative 5.43% dip during the same timeframe. When compared against Bitcoin (BTC), SOL’s performance has further dulled, manifesting a 1.70% decrease relative to the premier cryptocurrency.
Despite the immediate bearish outlook, Solana’s recent monthly trajectory paints a rather optimistic picture, with an 18.56% gain recorded over 30 days. The bullish sentiment extends to the last quarter as well, marking an impressive 80.04% uptick in the past three months. Zooming out for a year-over-year comparison, SOL has surged a staggering 753.31%, a significant leap from last year’s trading price of $20.57.
The current trading price beneath the 50-day Simple Moving Average (SMA 50) casts a shadow on the immediate bullish momentum, hinting at potential bearish pressure ahead. The longer-term analysis via the 200-day SMA (SMA 200) reinforces this sentiment, as SOL’s position below this key trendline suggests an overarching bearish market phase.
Anticipated Fixes Could Revitalize SOL’s Prospects
On the development front, Solana’s community and investors are eyeing April 15 with anticipation, marking the date set by developers to address transactional bugs that have recently impeded the network’s performance. While Helius Labs’ CEO has attributed the issues to an ‘implementation bug’ rather than a ‘design flaw,’ the network is under scrutiny for its operational reliability following significant activity spikes, primarily fueled by meme coin transactions.
solana’s current issue is not a design flaw, it’s an implementation bug
it is now hitting me that some folks might not understand what we’ve been trying to say by this for the past week
I’ll simplify it (intended for non-technical people)
it is important to make this… pic.twitter.com/fNZzu9f90S
— mert | helius.dev (@0xMert_) April 8, 2024
The SOL market is in a crucial phase as it balances recent positive trends against prevailing technical and operational challenges. The forthcoming patch is likely to play a critical role in shaping investor sentiment and could act as a catalyst for Solana’s price action.
SOL Struggles to Retain $175.0 level
SOL/USD 4-hour chart analysis reveals a market in search of direction, with Solana currently priced at $175.81, a modest 5.43% decline within the recent trading window. The price fluctuates below the 20-period Simple Moving Average of $182.72, a key technical level acting as immediate resistance. If SOL overcomes this hurdle, it could encounter the upper Bollinger Band at $191.21, suggesting room for an upward movement.
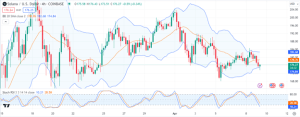

The Stochastic RSI stands at 27.66, teetering on the edge of the oversold region, which often precedes a potential upward price correction. Meanwhile, the MACD lingers below the signal line, signaling that bearish momentum has not fully dissipated. A potential shift could occur if the MACD moves above the signal line, reinforcing a more bullish market sentiment.
Support and resistance levels are in sharp focus, with SOL facing near-term resistance at the 20-period SMA of $182.72 and support indicated by the lower Bollinger Band at $168. Market participants are closely observing these indicators to gauge Solana’s next significant move in a market poised between contrasting signals.


