


A number of major cryptocurrencies have had a rough few weeks, with notable price dips. Solana (SOL), which is a high-performance blockchain network, has not been spared from this market’s bearish movements post-halving. As of writing today April 25th, SOL is trading at $146.56, marking a 6.94% drop in the past 24 hours. However, on a broader time frame, SOL has managed to record over 13% gain over the past seven days.
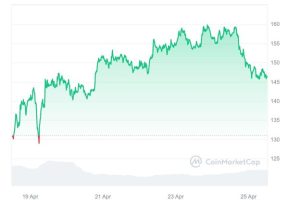

SOL Chart (CoinMarketCap)
Despite the price dip, Solana’s market cap remains at $65 billion, securing its position as the fifth-largest crypto by market cap. The network’s 24-hour trading volume stands at $3.9 billion which is a 25% gain in the last 24 hours.
Solana’s Unparalleled Transaction Volume
While the price fluctuations have caused concern among some investors, Solana’s underlying fundamentals remain strong. The blockchain network is renowned for its unparalleled transaction throughput, processing billions of transactions per month. In fact, Solana dominates daily transactions, accounting for over 30% across layer 1 and layer 2 networks, solidifying its position as the giant in transaction activity, a long-standing highlight of Solana’s performance.
Solana dominates daily transactions, accounting for over 30% across layer 1 and layer 2 networks.
It’s a powerhouse in transaction activity, a long-standing highlight of Solana’s performance. pic.twitter.com/75XRNMTuLe
— Kyledoops (@kyledoops) April 19, 2024
Resolved Congestion Issues
In a major development, the Solana team recently announced the complete resolution of the network’s congestion issues, with block production back to normal. Transactions are now being confirmed in under 2 seconds, a great achievement that sets Solana apart from its competitors.
🚨 BREAKING: @solana‘s congestion issues have been completely resolved, with block production back to normal.
Transactions confirming in under 2 seconds. pic.twitter.com/TdQVjSSRQI
— SolanaFloor | Powered by Step Finance (@SolanaFloor) April 24, 2024
SOL Technical Analysis
Solana’s price faced crucial resistance at the $209 zone over the past three weeks since early April. The weekly candles have closed bearish after rejection at the $209 resistance level, trading with high bear momentum and dropping over 20% in the last 30 days. However, the price found double support at the $125 zone on April 13th, both from a horizontal support level and an ascending trendline. The last week’s weekly candlestick formed a long-legged doji, indicating upward pressure.
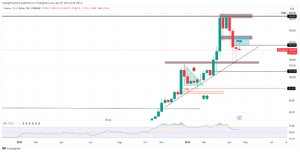

SOLUSD Weekly Chart (TradingView)
SOL Daily Analysis
Solana’s price is currently bearish trading towards a support level formed by an ascending trendline and a horizontal support level at $125 zone. The price has continued to drop after correcting to a fair value gap that it filled slightly. Today, SOL opened at $147.71 and has recorded a high of $149.49 and a low of $144.75 so far. The next target appears to be a retest of the ascending trendline and $125 horizontal support level. The Relative Strength Index (RSI) reading of 43 and the double support act as key indicators against further price drops, as it would push the asset into an extremely oversold region. However, if the support is broken, the next level of support lies at $110 low
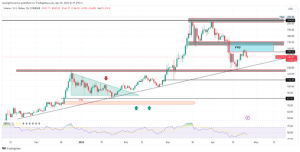
SOLUSD Daily Chart (TradingView)
4-Hour Technical Analysis
There is a significant fair value gap to be filled above the current market price and it is in the range of the $159 to $170 zone, which could act as a magnet to pull prices higher despite today’s drop. The RSI on the 4-hour timeframe of 42 also indicates that there is ample room for bullish activity before reaching overbought levels.
As the crypto market continues to navigate through this SOL volatility, Solana’s resilience and strong fundamentals position it as a potential contender for a swift recovery. With its unparalleled transaction throughput and the resolution of congestion issues, Solana’s future remains promising, provided the broader market conditions remain favorable.


