


As we close April, Shiba Inu faces a crucial period, reflecting a challenging market environment dominated by bearish trends, yet showing signs of potential rebounds influenced by recent developments. The meme coin, known for its volatile price movements, continues to draw attention from both speculative traders and crypto enthusiasts intrigued by its cultural impact and market dynamics.
Historically, May has been a mixed month for Shiba Inu, with significant declines in the past two years following a stellar surge in May 2021, when prices jumped by an astonishing 355%. However, in May 2022 and 2023, SHIB saw declines of 42.1% and 15.4% respectively,according to Cryptorank data. This pattern suggests that while May has the potential for gains, it has recently trended towards bearish outcomes, possibly due to broader market corrections or shifts in investor sentiment during this period.
Currently, Shiba Inu is trading at $0.0000225, down by 3.29% in the last 24 hours, with a 24-hour trading volume of $648,212,821. The coin’s performance this April also paints a bleak picture, marking a nearly 24% loss as it moves into May. This continued downtrend aligns with a broader bearish sentiment across the crypto market, influenced partly by external macroeconomic factors and specific events within the crypto space such as the Bitcoin halving.
Shiba Inu Listing on Binance Japan Sparks Price Movement
The introduction of SHIB/JPY trading on Binance Japan brought a slight uplift to SHIB’s price, demonstrating how market accessibility and expansion into new fiat pairs can positively impact demand. This listing led to a temporary price recovery as Shiba Inu approached the critical level of $0.000024. Such developments are crucial as they potentially broaden investor base and liquidity, contributing to more robust price support.
From a technical perspective, SHIB is encountering significant resistance around $0.000026. If bulls manage to push the price above this level, there could be a further ascent towards $0.00003, potentially catalyzing a rally towards $0.00005. However, the market shows resistance at these higher levels, and any failure to maintain upward momentum could see SHIB retesting lower supports. Recent patterns suggest a consolidation phase with possible breakout or breakdown, depending on broader market trends and investor sentiment in the coming days.
SHIB Technical Analysis on the 4-Hour Chart
The 4-hour chart for Shiba Inu (SHIB) presents a clear picture of its current trading sentiment, characterized by persistent resistance and fluctuating price action. As observed, SHIB has experienced a downward trajectory from its recent highs, struggling to maintain momentum above key resistance levels.
Shiba Inu’s price is currently in a delicate position, navigating through a series of Fibonacci retracement levels that play a crucial role in determining its short-term movements. After reaching a high near the 0.00000307 mark, SHIB has retraced and is now hovering around the 0.00000225 level, showing signs of potential stabilization.
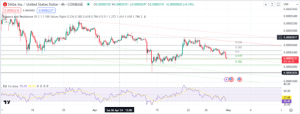

The Fibonacci retracement tool shows SHIB struggling below the 0.382 level at 0.00000260, which has acted as a stiff resistance zone. The subsequent drops in price have now positioned it near the lower support line at 0.00000225, which could serve as a critical point for the next directional move. A break below this support could see SHIB testing further lows towards 0.00000200, marked by the 0.786 Fibonacci level.
The Relative Strength Index (RSI) is currently just above the oversold territory, hovering around 30.55, suggesting that the selling pressure might be nearing exhaustion. This could potentially lead to a price stabilization or a minor bullish correction if buyers step in. However, the RSI also indicates that there is still room for further downside before a significant reversal is likely to occur.
The MACD indicator reinforces this bearish sentiment, with the histogram expanding in the negative territory and the signal line trending downwards. This suggests that the bearish momentum is strong, and any potential reversal would require a significant shift in market dynamics or investor sentiment.
Given the current technical setup, SHIB investors should watch for potential rebounds from the 0.00000225 support level. If this level holds, there could be an opportunity for a short-term bullish correction, potentially retesting resistance levels. However, a break below this support could lead to further declines, challenging the resilience of SHIB holders.
Shiba Inu is at a pivotal point on its 4-hour chart, with significant technical indicators suggesting the need for cautious trading. Investors should monitor these levels closely, as the next few sessions will likely be critical in determining the near-term trajectory of SHIB’s price.


