


The crypto world has witnessed a remarkable surge of Shiba Inu (SHIB), a meme-inspired token that has defied expectations and showcased its resilience in the face of market volatility. As we delve into the technical analysis, it becomes evident that SHIB’s rally is far from a fleeting phenomenon, fueled by a potent combination of strong support levels and unwavering bullish sentiment.
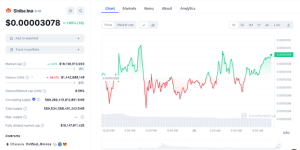

SHIB Data Chart (CoinMarketCap)
SHIB’s upward trajectory has been evident. Over the past month, SHIB has experienced an impressive over 198% increase, with over 14.5% surge in the last 7 days alone. Despite a slight 1.89% gain in the last 24 hours, the token’s market capitalization has soared to an impressive $18.1 billion as of writing, cementing its position as the 11th largest cryptocurrency by market capitalization.
Strong Support and Challenging Resistance
The technical analysis paints a compelling picture of SHIB’s journey. Its recent momentum can be traced back to a strong support level at the $0.00002500 zone, a crucial point that was last recorded on March 16th. As bulls continue to dominate the market, the potential for encountering confluence resistance at the $0.00003750 zone looms ahead.
On the weekly chart, SHIB’s price action has been trading bullish since hitting the $0.00002500 zone, with the token currently trading at a resistance level around $0.00003075 zone. The Relative Strength Index (RSI) stands at an elevated point of 78, indicating an overbought region that could potentially act as a barrier against further upward movement in the near term.
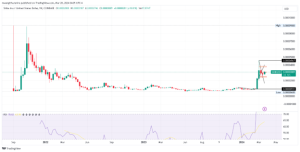

SHIBUSD Weekly Chart (TradingView)
Zooming in on the daily chart, SHIB’s bullish trend has been unfolding since it breached the $0.00002500 level. Meanwhile, on the 4-hour chart, the token hit support around the same zone and later broke out of a descending trendline from its recent high of $0.00004575. Currently, SHIB’s bullish momentum is slowing down as it encounters resistance at the $0.00003075 level.
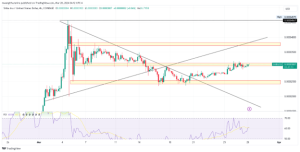
SHIB USD 4-Hour Price Chart( TradingView)
If SHIB manages to break through the current resistance level, it could rally to test the confluence of a resistance zone and an ascending triangle around the $0.00003750 level. Should this double resistance be breached in the near future, SHIB could potentially retest its yearly high of $0.00004575.
On the other side, in the event of a retracement with respect to the current resistance zone of 0.00003075, a retest and breakout of the immediate support level at the $0.00002500 zone may forego any further upward momentum. This could pave the way for SHIB to subsequently retest the descending trendline it broke out from on March 20th, 2024.
Indicators Align with Bullish Sentiment
On the key indicators, the daily Relative Strength Index (RSI) currently stands at 60, approaching overbought territory. While this could potentially signal a short-term pullback, the overall bullish momentum remains intact, further reinforcing SHIB’s upward trajectory.
Thoughts Moving Forward?
Shiba Inu (SHIB) continues to captivate investors and traders alike with its impressive bullish run and resilient performance in the cryptocurrency market. With potent and strong support levels in place and bullish momentum intact, SHIB remains poised for further upward movement, potentially encountering resistance at the $0.00003750 zone. As indicated by key technical indicators, the current market environment favors SHIB’s upward trajectory, further reinforcing confidence in its bullish outlook.


