


Shiba Inu (SHIB), the popular meme coin, is currently priced at $0.0000254, reflecting a slight decline of 2.36% over the last 24 hours. Despite this short-term dip, SHIB has maintained a steady increase of 11.8% over the past week, aligning closely with the broader bullish trend in the cryptocurrency market. This performance comes amidst the backdrop of significant developments such as the anticipated approval of the Ethereum spot ETF, which has stirred positive sentiments across related crypto assets like SHIB.
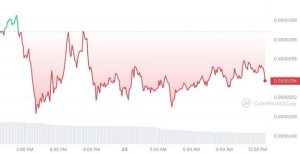

SHIB monthly chart: CoinMarketcap
The SHIB price has recently breached a two-month consolidation phase, signaling its readiness for an upward trajectory. After a local top at $0.0000457 in early March, the price formed lower lows and lower highs, culminating in a breakout above a declining trend line on May 20.
This movement was supported by a daily candlestick close above the $0.0000253 horizontal support, indicating increased buyer pressure. With the Relative Strength Index (RSI) flipping the 50 mean level into support and the Awesome Oscillator (AO) turning positive, technical indicators support a bullish outlook.
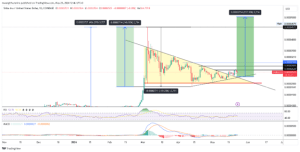

SHIBUSD Daily Chart: TradingView
Investors are now eyeing the next resistance level at $0.0000315, representing a potential 25% increase from current levels. A highly bullish scenario could push SHIB to retest the $0.0000355 mark, about the midpoint of the previous high and current levels. However, a daily close below the $0.0000210 support could invalidate this bullish thesis, potentially leading to a decline to $0.0000168, a 20% drop.
A significant surge in Shiba Inu’s token burn rate, which soared by approximately 569% on May 22, has slightly decreased the token’s circulating supply. This reduction is anticipated to drive the token’s price upward as market supply diminishes. Data from Santiment also shows a notable increase in daily active addresses, moving from below 4,000 at the beginning of the month to over 11,000, further underscoring the growing market activity and investor interest.
Shiba Inu Price Analysis: Consolidating Within Bollinger Bands
Shiba Inu (SHIB/USD) shows signs of consolidation in today’s trading session, hovering around the $0.00002552 mark. The cryptocurrency is currently trading just below the middle Bollinger Band (BB) 20 SMA, which stands at approximately $0.00002559, indicating a balancing point between buyers and sellers. The price has seen some fluctuations throughout the session, dipping as low as $0.00002539 and peaking at $0.00002553.
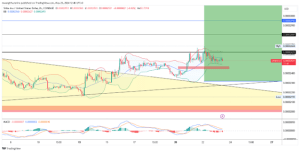
SHIBUSD 2-Hour Chart: TradingView
The 2-hour chart for SHIB/USD reveals that the price action is tightly enclosed within the Bollinger Bands, suggesting a period of low volatility and consolidation. Recently, the price has moved slightly above the lower Bollinger Band, indicating a potential rebound towards the middle or even the upper band, if bullish momentum increases.
The bands are beginning to narrow, which could foreshadow a significant price move in the near future, either upwards or downwards, as the market decides on a more definitive direction. This consolidation phase follows a more volatile period where the price spiked and then corrected, underscoring the market’s current uncertainty.


