


Shiba Inu (SHIB), a meme crypto, is gearing up for a massive rally, with analysis predicting a 117% surge in its price. This bullish outlook is backed by a confluence of technical indicators, whale activity, and a spike in the token burn rate.
As of press time, Shiba Inu is trading at $0.0000255, which is up 5.15% in the last 24 hours and 8.60% over the last 7 days. Its market cap stands at over $15 billion. Impressively, the 24-hour trading volume has surged by 137% to $878 million.
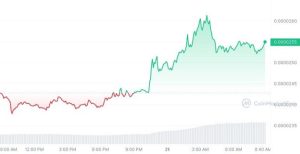

SHIB Price Chart: CoinMarketCap
On May 20th, the number of SHIB tokens burned increased by a whopping 56.16%, according to data from Shibburn before dropping. This significant uptick in token burning aims to create scarcity and reduce inflationary pressure, potentially driving up the value of the remaining SHIB tokens in circulation.
While an increase in the burn rate does not always translate directly into price appreciation, it is a positive signal that the SHIB community is actively working towards enhancing the token’s value proposition.
Why Expect a Price Surge Soon?
A number of metrics and technical indicators back this potential surge. Whales and institutional investors have been accumulating SHIB tokens during recent dips, as evidenced by Santiment’s consistent spikes in the Whale Transaction Count between May 12 and May 21. This activity suggests that deep-pocketed investors are positioning themselves for a potential price surge.
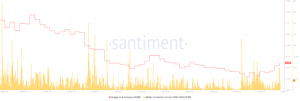

Supply On Exchange and Whale count: Santiment
Furthermore, the supply of SHIB tokens on exchanges has been decreasing recently, indicating that investors are moving their assets to private wallets in anticipation of future price increases. This trend is typically interpreted as a bullish signal, as it suggests increasing buying pressure and a potential supply squeeze.
Further, the technical analysis of SHIB’s price action paints an equally optimistic picture supporting the 117% rally prediction
SHIB Technical Analysis
Since hitting a high of $0.00004575 on March 5th, the SHIB price corrected by 59%, dropping to a low of $0.00001837 on April 13th. This correction followed after a remarkable 436% rally from a low of $0.00000843 on January 23rd.
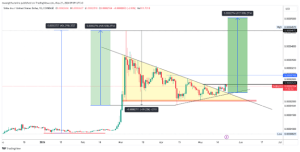

SHIBUSD Data Chart: TradingView
After a prolonged period of consolidation within a descending triangle pattern, SHIB bulls finally broke out on May 15th, closing above the triangle’s resistance. This breakout is a significant bullish signal, potentially setting the stage for a substantial price surge.
The immediate targets for SHIB are $0.00002950, $0.00003303, and a retest of the recent high at $0.00004575. If the 117% rally materializes, the premium target is set at $0.00005.
In lower timeframes, the resistance zone at $0.00002620 is a crucial level to watch. If the price can flip this zone into support, it could provide additional momentum for the bulls and pave the way for new higher highs.
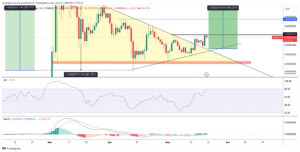
SHIB Indicator Chart: TradingView
Supportive Indicators:
The Moving Average Convergence Divergence (MACD) indicator is positive, suggesting bullish momentum. At the same time, the daily Money Flow Index (MFI) stands at an overbought high of 78%, signaling substantial bullish momentum building over the last 24 hours.
With technical indicators aligning, whale accumulation, and a surge in token burning, the stage seems set for SHIB to embark on a remarkable 117% rally and beyond.


