


Shiba Inu price analysis shows a bearish trend as the meme coin struggles to make any significant upward movement amid broader market stagnation. Currently, Shiba Inu is trading at approximately $0.000013, marking a decline of 3.36% in the last 24 hours. This recent performance is part of a longer bearish trend that has seen SHIB trading within a very narrow range, oscillating between $0.000013 and $0.00001370. Despite the general market’s slight recovery from August’s lows, Shiba Inu has not seen significant buying interest, with its price action confined within tight boundaries.
The trading volume for Shiba Inu has been relatively low, suggesting a lack of enthusiasm among traders. With a volume of $210,589,711, there appears to be a decreasing interest from both retail and institutional investors. This is mirrored by the recent sideways price action, indicating a balance between supply and demand at current price levels.
Daily Chart Analysis: Narrow Consolidation Hints at Uncertainty
On the daily timeframe, Shiba Inu’s price remains below key moving averages, which act as strong resistance levels. The 50, 100, and 200-day Exponential Moving Averages (EMAs) are all positioned above the current trading price, reinforcing the bearish outlook. Additionally, the Parabolic SAR indicators show a pattern of dots above the candlesticks, suggesting that the downtrend is likely to continue unless there is a significant shift in market dynamics.
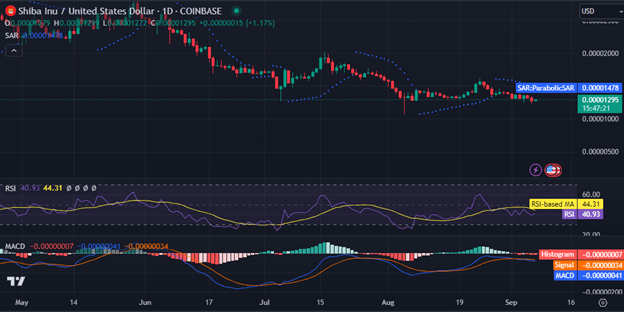

The Fibonacci retracement tool highlights a recent bounce off the 0.618 level, signaling some buying interest at lower price points. However, the lack of follow-through on these bounces suggests that any upward movement is likely to be capped by the overarching bearish sentiment. The narrow trading range and absence of significant price changes underscore the market’s current wait-and-see approach, with many investors likely holding off on large positions until more definitive trends emerge.
The technical indicators reflect this sentiment, with the Moving Average Convergence Divergence (MACD) showing minimal divergence and the Relative Strength Index (RSI) hovering around 44.31, pointing to a lack of strong buying or selling momentum.
Four-Hour Chart Breakdown: Immediate Resistance and Support Levels
The four-hour chart provides a closer look at Shiba Inu’s short-term price movements, which continue to exhibit tight consolidation. The Bollinger Bands on this timeframe are relatively narrow, indicating low volatility and a potential buildup to a more decisive price move. The current price is hovering near the lower Bollinger Band, which could act as a short-term support level.
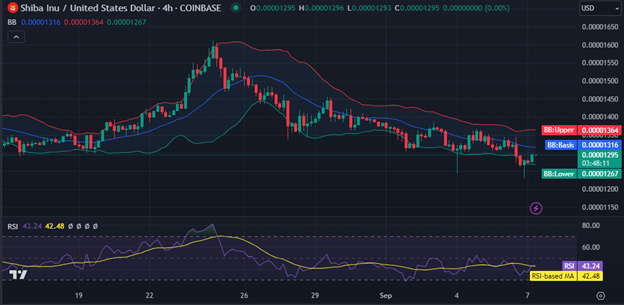

The RSI on 4Hr is higher than on daily so some buying in the smaller time frames but not enough to break the immediate resistance at $0.00001370. If SHIB breaks this resistance the next level to watch is the middle BB at $0.00001316 which could be a pivot.
Shiba Inu (SHIB) Whales Retreat as Large Transactions and Wallet Activity Decline
Recent on-chain data shows Shiba Inu (SHIB) whales are retreating with big transactions declining. Over the last 24 hours big SHIB transactions dropped by 57.73% to 1.12 trillion SHIB. That’s a big drop in dollar value, from $35.9 million to $14.8 million. There were 48 big transactions above $100,000.
The inflows and outflows to wallets with 0.1%+ SHIB also declined. The Large Holders Inflow indicator shows inflows to those big wallets dropped 61.7% to 295.42 billion SHIB. Outflows also dropped 45.47% to 300.38 billion SHIB. Whales are stepping back from SHIB probably due to the bearish sentiment and no big moves in the token.


