


Shiba Inu (SHIB) continues to struggle in a bearish market environment, as indicated by its consistent decline over the past few weeks. The recent price data shows a slight recovery, but overall, the trend remains downward. The candlestick chart shows a continuing downtrend with the price currently at $0.00001335, having declined by approximately 3.65% in the last 24 hours. This movement is within a broader falling channel, which typically signals ongoing bearish momentum.
The token’s market cap stands at $7.85 billion, placing it 13th in the cryptocurrency rankings. Despite a slight recovery prompted by Bitcoin’s resurgence, SHIB faces significant resistance at key exponential moving averages (EMAs). Shiba Inu’s price action reveals a consistent downward trend within a falling channel pattern, indicating strong bearish momentum. Shiba Inu has found support around $0.000012, with a stronger support level at $0.00001. If the price fails to re-enter the falling wedge, it may drop 18% to the previous six-month low of $0.00001082.
BTC Technical Indicators Signal Further Decline
The SHIB price broke down from a falling wedge pattern on August 3, indicating strong bearish momentum. Typically, a falling wedge suggests a potential bullish reversal, but the breakdown signals extreme bearish pressure. The SHIB price needs to re-enter this pattern to regain bullish momentum. Immediate resistance levels are seen at the 50-day EMA ($0.00001425) and the 200-day EMA ($0.00001628).
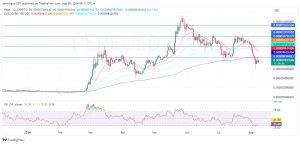

The RSI stands at 47.61, approaching the neutral zone, indicating that the asset is neither overbought nor oversold. A steady decline in volume during the recent minor upward move indicates bearish volume-price divergence, supporting the continuation of the bearish trend unless a significant breakout occurs. The market shows a bearish sentiment as the price remains below both the 50-day and 200-day EMAs, confirming the ongoing downward trend.
Support and Resistance Levels: Immediate support can be identified around $0.00001265, a level tested multiple times over the last month. Significant resistance is seen near $0.00001355, aligning with recent highs and the downward trend line.
Data from Coinalyze shows SHIB’s open interest dropped by 4.54% over the last 24 hours, indicating money flowing out of the Shiba Inu market. This suggests the recent minor uptrend may be ending, potentially leading to a continued bear trend.
SHIB On-Chain Analysis
According to data from IntoTheBlock, over 26,000 Shiba Inu holders face jeopardy as their 14.29T ($190 million) tokens may soon enter unrealized losses. This adds to the 542T ($7.24 billion) tokens that have been underwater for almost three weeks.
In case SHIB price goes past $0.00001344, it could break back into falling wedge thus changing its direction to bullish.Breaking above the 50 EMA might position it for an impulsive bullish action towards $0.00001625 and even $0.000018.
Current trend for Shiba Inu (SHIB) remains bearish with strong resistance at key EMAs and support levels at $0.000012 and $0.00001; RSI and CMF indicators showing possibility of reversal if buying pressure will increase.Forecasting what will come next for SHIB will heavily rely on watching these crucial levels as well as market conditions..
Short-term, SHIB needs to break above $0.00001344 in order to re-enter into falling wedge thereby establishing uptrend.For failure to happen this would add to already huge unrealized losses for SHIB holders and make the price drop to previous six-month low of $0.0000


