


The popular meme crypto Shiba Inu (SHIB) has seen significant price movements over the past month, with the coin currently trading at $0.00002674, according to the latest market data. Over the past month, SHIB has experienced a massive 31.23% decline, while the past 7 days it has brought a 12.97% drop and a slight 0.08% increase has been witnessed in the past 24 hours. Is this the start of a bull run?
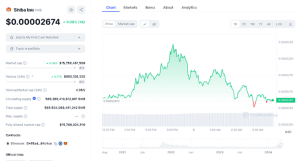

SHIB Data Chart (CoinMarketCap)
With a market capitalization of over $15.7 billion, Shiba Inu ranks as the 12th largest cryptocurrency by market cap. The 24-hour trading volume for SHIB stands at over $680 million, which represents a 6.77% increase in the last 24 hours. The volume-to-market-cap ratio for SHIB over the past 24 hours is a respectable 4.35%.
SHIB Technical Analysis Paints a Mixed Picture
SHIB reveals a mixed picture, with both bullish and bearish signals present. On the weekly chart, SHIB has been caught in a ranging channel between $0.00002500 and $0.00003150. Since hitting a high of $0.00004575 on March 4th, SHIB has traded mostly to the downside, with only last week’s candlestick closing bullish.
This week, however, the weekly candlestick is trading below last week’s close, indicating more bearish sentiment. Notably, the price is facing a crucial support level at the ranging channel’s bottom. The Relative Strength Index (RSI) stands at 68.51, close to an overbought region, which could act as a barrier against further upward movement in the near term.
On the daily timeframe, the price has been trading bullish since hitting the $0.00002500 zone, with yesterday’s (April 4th, 2024) daily candlestick closing bullish. Today, however, the daily candlestick is showing signs of bearish sentiment as of writing.
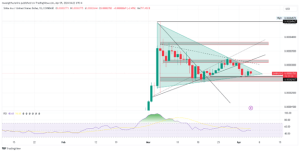

SHIBUSD Daily Chart (TradingView)
Since March 15th, the price has been trapped in a ranging channel, with price testing the support level of $0.00002500 on March 20th, where it was rejected before rallying to test the ranging channel’s resistance at around $0.00003150, March 28th, where it faced another rejection.
Bullish Pennant Pattern Offers Hope
Encouragingly, since April 3rd, the price has tested the support of the ranging channel and the base of a bullish pennant pattern, which indicates potential bullish market sentiment. This confluence with the daily RSI reading of 47, close to an oversold zone, suggests that bullish momentum may emerge in the near term.
On the 4-hour chart, SHIB hit the support level around $0.00002500 on March 20th and later broke out of a descending trendline from its recent high of $0.00004575. Yesterday (April 4th), SHIB tested the bullish pennant support together with the ranging support formed when the price broke out of the descending trendline.
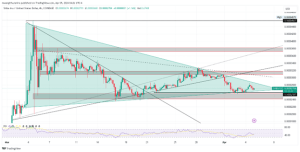
SHIBUSD 4-Hour Chart (TradingView)
If a rejection is witnessed at this crucial double support (ranging channel support and bullish pennant support), prices may rally to test a confluence of resistance around $0.00003120, including the ranging channel resistance, a retest of the ascending trendline broken on April 1st, and a descending dotted trendline.
In the event of further downward pressure, a breakdown of the immediate support level at $0.00002500 could precede any further upward momentum in the near future. However, the bullish sentiment holds more strength at the moment, fueled by the bullish pennant pattern and the RSI readings close to the oversold region.


