


In the world of meme coins, Shiba Inu (SHIB) finds itself at a critical crossroads, surrounded by a mix of cautious optimism and market hesitancy. Currently priced at $0.00002483, SHIB has recently shown a slight retreat amid broader market fluctuations. This minor downturn is influenced by a variety of factors including technical analyses, significant whale movements, and evolving market sentiment.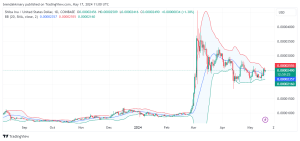

The price trajectory of Shiba Inu has been notably dynamic over the past few weeks. After a challenging start to the month, where SHIB dropped to as low as $0.00002156 on May 13, it retested the lower Bollinger Band, signaling an oversold condition. This downturn was momentarily halted with a recovery that pushed the price towards the upper Bollinger Band at $0.00002588.
Bollinger Bands Indicate Potential Turnaround
Despite a recent drop in volatility, market analysts observing a symmetrical triangle formation on the daily chart have noted that SHIB has broken above the triangle’s upper trendline, suggesting that a bullish trend could be forming. This breakout aligns with predictions of reaching the $0.00006 price level, representing a potential 147% increase from its curren value.
Meme pumpers are eagerly waiting for a breakout. pic.twitter.com/3IQx4nZxHV
— Nebraskangooner (@Nebraskangooner) May 15, 2024
Shiba Inu has experienced significant price movements since early May,which resulted in a price dip to $0.00002156. This movement suggests that Shiba Inu may be venturing into oversold territory, indicating a weakening of the ongoing downtrend. A detailed analysis of the daily chart shows Shiba Inu brushing against the upper Bollinger Band at $0.00002588, facing resistance but hinting at the potential for upward movement should the bulls gain enough momentum to drive a breakout above this level.
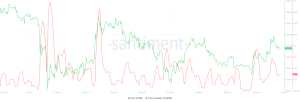
SHIB Volatility and Market Sentiment
A contraction in the Bollinger Bands points to reduced market volatility, a precursor often observed before sharp price movements. According to data from Santiment, SHIB’s volatility decreased significantly on May 12, reaching its lowest point in three months. This decrease in volatility, similar to patterns observed before Shiba Inu’s surge in late February, may be setting the stage for another substantial price movement

Despite these indicators of potential price increase, Shiba Inu’s price slipped again as a result of a large transaction noted on May 14, where a whale moved 199 billion SHIB to Coinbase, contributing to the price volatility.
Shiba Inu Stumbles Amid Market Volatility
On the 4-hour chart, Shiba Inu (SHIB) exhibits signs of consolidation with a slight bearish undertone. The cryptocurrency is currently trading at above $0.00002486, closely testing the immediate resistance level at $0.00002497.
If SHIB manages to break this resistance, it might aim for higher levels, potentially targeting the next resistance at $0.000025, followed by a more significant level at $0.00002600. These potential movements align with key Fibonacci retracement levels, indicating where sellers might re-enter the market.
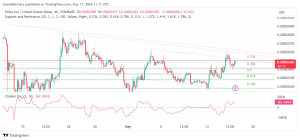
In terms of support, SHIB shows a crucial support at $0.00002462. A breach below this point could lead the price to test further support around the $0.00002400 mark, which correlates with the 0.786 Fibonacci level.
The Chaikin Money Flow on the chart points to an increasing buying pressure, suggesting that there might be enough momentum building up to challenge the current resistance levels. However, traders should remain cautious as any shift in market dynamics or volume could swiftly change the direction, pushing it towards these lower support zones.


