


Ethereum experienced an impressive 5% surge over the last 24 hours, reclaiming the critical $3,000 level.
Independent analyst Jelle spotted Ether trading just above $3,00 saying, after the relative strength index successfully reset from the oversold region, ETH is poised to go higher.
“Pretty good bet here in my opinion.”
$ETH looks like this, with the ETFs about to go live for trading.
RSI fully reset, local lows taken out — no Mt. Gox & Germany supply overhang…
Pretty good bet here imo. pic.twitter.com/Uj6PDCBhMp
— Jelle (@CryptoJelleNL) July 8, 2024
Despite this positive outlook from Jelle, derivatives data and technical indicators show that the price remains weak even as another bearish wave looms for ETH.
Reducing demand for for leverage longs
Ethereum’s substantial 20% drop from July 2 highs above $3,500 have pushed its futures open interest to $12.13 billion, down from $14.98 billion. Still, in futures markets, leverage longs and shorts are constantly matched, so it’s crucial to examine ETH’s funding rate for a more nuanced perspective.
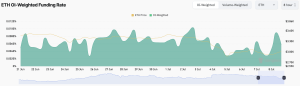
A positive funding rate indicates that longs (buyers) demand more leverage, while the opposite occurs when shorts (sellers) require additional leverage, resulting in a negative funding rate.

ETH futures average funding rate, 8-hour. Source: CoinGlass
Although Ethereum’s current futures funding rate represents a 0.12% weekly cost for leverage longs is significant given the recent bearish momentum, it is a significant shift from the funding rate levels observed at the start of the year when longs were paying for leverage use.
This suggests that the longs are demanding less and less leverage, which could be interpreted as bearish.
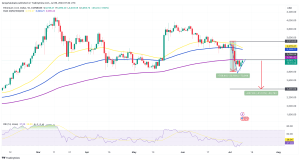
Ether’s bearish flag projects ETH price at $2,400
After reaching a low of $2,809 on July 5, ETH price pulled up as buyers bought on the dip and the wider crypto market recovered.
Despite the recovery, a bear flag can be seen on the daily chart, which hints at the continuation of the downtrend.
ETH faces resistance from the flag’s upper boundary at $3,080. A daily candlestick close below this level would see the price drop toward the lower boundary of the flag at $3,000. Losing this support would signal a possible downward breakout from the chart formation, projecting a drop to $2,400. Such a move would represent a 21.6% descent from the current price.

ETH/USD daily chart. Source: TradingView
The 50-day exponential moving average (EMA) and the 100-day EMA were both facing downward, suggesting that the market conditions still favoured the downside. The value of the RSI at 37 indicated that the bears still dominated the market.
On the other hand, if the bulls push the price above the flag’s upper limit at $3,080 would provide the first line of resistance. Additional barriers could emerge from the $3,300 and the $3,400 where the 10-day and 100-day EMAs sit. Bulls must overcome this buying pressure from this supplier congestion area before reaching the July 3 swig high above $3,500.


