


According to the latest market data, MATIC is currently trading at $0.7544, up 3.4% in the last 24 hours and an impressive 7.8% over the last seven days. With a market cap of over $7 billion as of writing, MATIC ranks as the 17th largest crypto by market cap. Its 24-hour trading volume stands at over $284 million.
As the first quarter of 2024 for MATIC draws to a close, the crypto space anticipates as Polygon Labs preparing to share a summary of its progress and achievements tomorrow, April 24th. This highly anticipated update comes at a pivotal moment for Polygon’s native token, MATIC, which has been making waves in the market recently.
As we conclude the first quarter of 2024, the Polygon Labs team will be sharing a summary of Q1 progress and achievements.
Set your reminders ⬇️
https://t.co/EvHBwTTYoX— Polygon | Aggregated (@0xPolygon) April 23, 2024
MATIC Technical Analysis
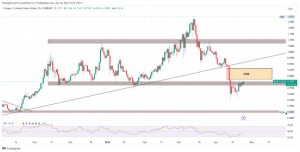
MATIC’s weekly chart tells a tale of resilience amidst bearish sentiment. For several weeks, starting from the weekly candle beginning on March 11th, Polygon has experienced a prolonged bearish streak, with five consecutive weekly candles reflecting downward pressure and closing bearish. This bearish pressure has led to a 26% drop in MATIC’s price over the last 30 days.

MATICUSD Weekly Price Chart (TradingView)
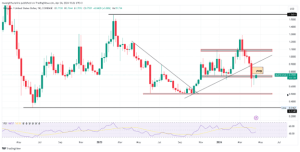
However, on April 13th, MATIC’s price created a low of $0.59 after breaking through a crucial horizontal support level at $0.72. Since creating the low, the token has been trading on an upward trajectory and is currently retesting the $0.72 horizontal support zone it previously breached which has now turned to a resistance level. The Relative Strength Index (RSI) reading of 44 signals a strong potential for bullish activity, as it has been from an oversold condition, leaving ample room for a price rally.
MATIC Daily Technical Analysis
MATIC is currently trading at a resistance zone, exhibiting signs of a potential breakout and continued upward momentum, with several confluences supporting this bullish outlook. One, a fair value gap lying above the current market price, acting as a magnet pulling prices higher. The second reason we have RSI reading of 43, slowly correcting from an oversold reading and the likelihood of bullish activity and the third confluence the possibility of retesting the broken ascending trendline from April 12th.
MATICUSD Daily Chart (TradingView)
If MATIC succeeds in breaking through the current resistance, the next target is more likely to be the $0.9 level at the ascending trendline retest, effectively fixing the market imbalance above. However, if the resistance holds, bears may regain control, potentially testing the $0.59 low, where the RSI would be in extremely oversold conditions. Currently, RSI reads at 43.
MATIC 4-Hour Technical Analysis
MATIC is gradually trading slightly above the $0.72 resistance zone, but a confirmed breakout on higher timeframes has yet to occur. The Fair Value Gap clearly lies above the current market price, suggesting a higher likelihood of upward price movement despite the RSI reading of 64 approaching overbought territory.
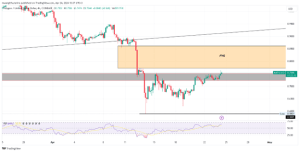
MATICUSD 4-Hour Chart (TradingView)
Thought Moving Forward?
Despite MATIC’s recent surge beyond $1and its market cap exceeding $10.9 billion recently, some investors remain cautious about its short-term prospects due to potential price corrections and growing pessimism among social indicators. However, MATIC’s long-term potential remains intact, driven by its scalable blockchain solutions, ecosystem utility, strategic alliances and technological advancements.
While market dynamics may temper short-term developments, MATIC’s fundamentals and strategic positioning make it a compelling investment opportunity for those with a long-term investment horizon.


