


Since Polygon Labs announced its multichain vision June 2023 it has made influential developments. A key development in this journey has been the introduction of the Polygon Chain Development Kit (CDK) which is designed to empower projects to launch their own Ethereum Layer 2 chains and integrate easily into the broader Polygon ecosystem. This strategic move aims to improve the utility and scalability of the Polygon network and potentially boosting its market value and user base.
On partnership, a collaboration between Cros and Polygon aims to transform the gaming industry by linking game developers, advertisers and a massive audience of 3 billion players. The partnership leverages $CROS to drive in-game advertising, utilizing Ethereum’s Layer 2 solutions to ensure quicker transactions, reduced costs and AI driven monetization strategies. This could greatly enhance player engagement and open new revenue streams for developers.
Cros and Polygon partnership is set to revolutionize the gaming world 🚀🚀🚀
Connecting game developers, advertisers, and 3 billion players🔥🎮🔥$CROS is igniting in-game ads with Ethereum L2 for faster transactions, lower cost, and AI-driven monetization💰🚀💥#CrosXPolygon… pic.twitter.com/8ot6HPHT17
— Cros (@Cros_Worlds) June 5, 2024
As of writing today, the Polygon native token – MATIC, is trading at $0.723 marking a slight increase of 0.93% in the last 24 hours. The token market cap stands at $7.15 billion which places it 18th in rankings of top digital assets. The trading volume of $316 million which has gained 40% in the last 24 hours indicates a healthy liquidity ratio of 4.40%. This active trading volume shows the market interest and the speculation that is surrounding MATIC while at this level.
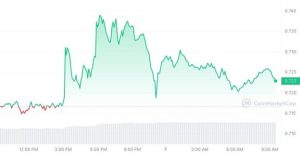

MATIC Price Chart: Coinmarketcap
MATIC Technical Analysis
Currently Polygon is trading at a crucial level. Following a significant 54% correction from a high of $1.29 on March 14th to a support level of $0.59 on April 12th MATIC has been consolidating for nearly two months now. Today as of writing MATIC is approaching a key resistance level which it has attempted to breach four times recently and was rejected. This ongoing consolidation below this resistance level hints at a build up of buying pressure and more accumulation.
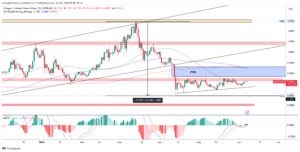

MATICUSD Daily Chart: TradingView
The technical indicators also offer additional insights. The MACD has just recently seen a bullish crossover and is currently above the signal line indicating increasing bullish momentum over the last four days as indicated by the daily candles closing bullish.
The Relative Strength Index stands at 52 which means that the market is neither in an overbought nor an oversold region and provides room for potential movement on either side.
The 50 day Exponential Moving Average is currently below the current market price which signals a potential support while the 100 and 200 EMAs are positioned at $0.84 and $0.85 respectively, acting as resistance levels.
If MATIC successfully breaks out and closes above the current resistance it could confirm recovery signs and begin a bullish trend reversal, pushing the price towards $0.90 recent high and approaching the $1.00 mark where there is an ascending trendline. On the other side, a rejection at this resistance level could lead to a retest of the $0.59 low or even more drop to the $0.50 horizontal support level.


