


PEPE’s Price Surge Unveiled: A Deep Dive into Indicators and Future Projections
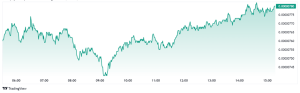
Pepe, a well-known meme-based cryptocurrency, recently enjoyed a bullish trend, attracting attention from traders and investors as its value rose. However, the market’s dynamics swiftly shifted in the opposite direction. The cryptocurrency has since experienced a significant pullback, with Pepe’s current price at US$0.00000780, reflecting a 7% decline. This downturn suggests a shift toward bearish sentiment in the market.

Price action:
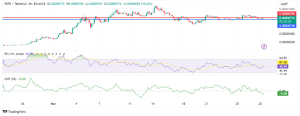
A continued bearish trend could see Pepe’s price fall below US$0.00000780, possibly dropping to a support trendline at us$0.00000748, indicating heightened market pressure. And major resistance is maintained at US$0.00000784.
Even with prevailing challenges, there are signs pointing towards a potential bullish resurgence. The Moving Average Convergence Divergence (MACD) indicator displays a bullish pattern. However, the Chaikin Money Flow (CMF) index, standing at 0.08, implies a likely decline in the market. However, the Relative Strength Index (RSI) for PEPE/USD remains at 48.99, suggesting a market stance that is neutral to slightly bearish. These technical indicators, though not definitive, offer a mixed view of the market sentiment.

PEPE price analysis:
The trading volume of Pepe has notably decreased by 31% to $776 million, reflecting a broader trend of reduced trading activity. Despite this, Pepe maintains a strong position in the cryptocurrency market, currently ranked 42nd on CoinMarketCap with a live market cap of $3.3 billion.
Anticipation is mounting for the Bitcoin halving event, which is expected to bring about a potential uptick across the crypto market, including for meme tokens like Pepe. There is hope that meme tokens, along with major cryptocurrencies in the Ethereum and Solana ecosystems, will regain momentum after the recent market correction.
The cryptocurrency market is undergoing significant adjustments, with key players such as Bitcoin and Ethereum experiencing declines below their respective benchmarks of $69,000 and $3,600. This downturn has led to increased selling pressure, exacerbating the overall market slump and impacting the wider cryptocurrency landscape.
Pepe’s price has displayed volatility, fluctuating between $0.00000720 and $0.00000860 over the past week. This indicates a market characterized by uncertainty, with neither bullish nor bearish trends gaining definitive momentum.
If Pepe surpasses the $0.00000800 threshold, it could target a significant resistance level at $0.00000850, potentially breaking out of its current trading pattern. A successful breakthrough could lead Pepe to aim for a more ambitious resistance at $0.00001000.
Pepe Coin’s price in April 2024
Analysts’ predictions for Pepe Coin’s price in April 2024 vary widely. The most optimistic outlook suggests a potential high of $0.0000108, indicating a potential gain of more than 38.1%. Conversely, the lowest price target projected by analysts is $0.0000059. These differing perspectives reflect the uncertainty and volatility inherent in the cryptocurrency market, where price movements can be influenced by various factors. Investors should consider these projections alongside other market data and conduct thorough research before making any investment decisions.
Pepe’s Mean Coin Age on the Upward Trend
Given Pepe’s historical price movements and the current market conditions, many are speculating about the potential for another price jump. The Mean Coin Age for PEPE has consistently increased from the beginning of March, indicating a time of accumulation among holders. This metric, which measures the average age of all coins in circulation, reflects investor sentiment and behavior.
A rising Mean Coin Age suggests that holders are choosing to hold onto their assets rather than sell them, pointing towards a bullish sentiment in the market. This trend is reinforced by the recent decrease in supply on exchanges, further bolstering the case for a potential price surge.
EMA Lines Indicate Consolidation and Potential Price Stability
While the Exponential Moving Average (EMA) lines do not indicate a strong bullish trend, they do suggest a pattern of consolidation in the market. EMA lines, which assign more weight to recent price data, are closely converging with the current price trajectory.
This convergence, especially with short-term EMA lines positioned above longer-term counterparts, is seen as a positive signal by investors. It implies that the price of PEPE may be stabilizing, potentially setting the stage for future price increases.


