


Pepe (PEPE) price has been bullish in the last 24 hours after establishing support at the intra-day low of $0.000008976. Bulls soared the price to an intra-day high of $0.000009873 before facing stiff resistance. PEPE was trading at $0.00000925 at press time, a 1.22% surge from the intra-day low.
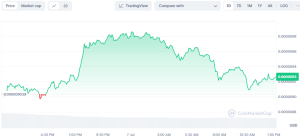

PEPE/USD 1-day price chart (source: CoinMarketCap)
During the recovery, PEPE’s market capitalization increased by 1.23% to $3,891,436,180, while the 24-hour trading volume dipped by 30% to $659,061,084.
Recent Performance and Investor Sentiment
Concurrently, over the last week, it has dived by more than 21%, and many investors have lost out massively. However, now there is overall positive sentiment on PEPE as well.
When the data on price decline was sourced from CoinMarketCap, with the published data, it reflected that the falling price has kept just 67% of investors in profit; previously, it was 90%. But sentiment in the market is for a considerable uptrend turnaround and a positive recovery.
The weighted sentiment towards PEPE has been getting better all the time, which indicates how much confidence investors have. This change in sentiment aligns perfectly with the recent price action of this meme coin, which seems to be starting to reach the point of a critical juncture on the charts. If price action history repeats itself within the price of this chart, there’s probably a bullish trend in the cards.
Technical Analysis and Potential Patterns
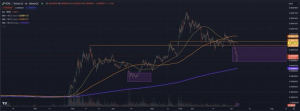
Taking a closer look at the daily chart for PEPE, we have a falling wedge that is bullish in nature. Such a pattern may indicate a breakout if the price tests the lower trendline and bounces off it. Such patterns in the past have led to massive price rises.
According to the crypto-analyst Plazma, the price of PEPE is approaching its 200-day simple moving average (SMA), a critical level that has previously provided gains. In April, a test of this type led to an all-time high. If the trend continues this way, PEPE can catalyze a vast uptrend that may reach the peak level previously achieved.

The trading volume in PEPE has been very active, and it has been reflecting the price change. As prices moved higher, so did the trading volume, thereby indicating vigorous buying demand. However, when the plummet occurred, the rise in trading volume represented substantial selling pressure.
The overall trend in price was also reflected in an increase in market capitalization for PEPE, as it slightly went up. The Volume/Market Cap ratio is still up at 17.15%, which means that trading is very much active. This ratio shows how strongly the market reacts to price change in terms of substantial trade volumes relative to market cap size.
Support and Resistance Levels
For this, it is essential to understand support and resistance levels for the making of predictions of future price movement. The price pulled back from the recent high of $0.0000098; that should be a point of resistance. On the contrary, the lowest price in the recent period serves as a support level, which is at around $0.0000090. The price bounced from that level, reflecting some interest in buying.
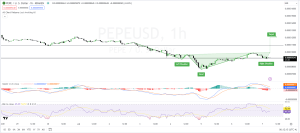

PEPE is trading at around $0.00000925, slightly closer to the identified support level. This has the potential for a bounce if this level supports. As such, traders should pay close attention as an escape above the resistance or a drop below the support may govern the next key directional move.
Future Outlook and Price Predictions
Should PEPE sustain the uptrend, it will recover the recent losses and maybe establish a new all-time high. According to Hyblock Capital analysis, should the bullish momentum continue, the price of PEPE in the following days may hit $0.000012.
In contrast, the price might drop toward $0.00000727 if bearish sentiment dominates. Investors and traders, subsequently, need to look for either the 200-day SMA or the falling wedge pattern to receive bullish confirmation signals. The current market sentiment and technical indicators leave a cautiously optimistic view for PEPE that a new rally may be at hand.


