


Litecoin (LTC), one of the pioneering crypto assets, is undergoing a potential bullish resurgence as its network activity and overall utility reach new heights. Data from the Litecoin Team in early May reveals that LTC has been the most dominant crypto on the BitPay payment processor all year, recording an impressive 41% market share.
As of press time, Litecoin is trading at $83.84, up 0.08% in the last 24 hours but down 3.01% over the last 7 days. It has a market cap of $6.25 billion, ranking 21, and with a 24-hour trading volume of $317 million.
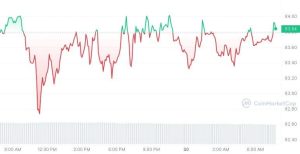

LTC Price Chart; CoinMarketCap
Litecoin’s adoption and practical applications in digital payments are growing as more merchants and businesses embrace crypto as a means of transaction.
Reflecting this positive sentiment, the Litecoin price has shown resilience, maintaining above the $80 zone over several days. This upward momentum has raised expectations of further value appreciation in the coming days and weeks.
On-chain data provided by Santiment, a leading blockchain analytics platform, further reinforces the bullish narrative surrounding Litecoin. The Total Amount of Holders chart has revealed a growing number of new wallets created on the Litecoin network in recent days, signaling an inflow of new people capitalizing on the recent price dip.
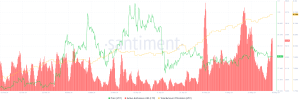

As of May 30th, the number of active addresses on the Litecoin network stood at 522K, a significant increase from the 449.29K recorded just a month earlier on April 30th. This surge in active addresses suggests that the number of holders joining the network has outpaced those exiting their positions, painting a picture of overwhelming positive sentiment within the Litecoin ecosystem.
Complementing this on-chain data, the Total Amount of Holders metric has also exhibited steady growth, increasing from 7.8 million at the start of February to the current reading of 8.22 million. These on-chain indicators collectively point to a high likelihood of further price gains for Litecoin in the days ahead.
LTC Technical Analysis
LTC price action has been seen by a consolidation phase following a recent surge that saw prices rally to a high of $112 on April 1st before correcting 37% to find horizontal support at $70. Since then, LTC has been trading within a horizontal ranging channel between $78 and $88, respecting an ascending trendline that has been in place since January 24th.
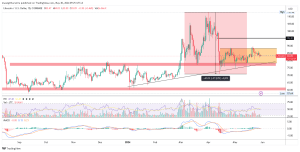

LTCUSD Daily Chart: TradingView
A breakout above the $88 resistance level could confirm a bullish reversal after the current 37% correction, allowing prices to fill the fair value gap around $88-$95 and continue to new highs beyond the recent $112 high. On the other hand, a breakdown below the $78 support, which confluences with the ascending trendline, could trigger further downside toward the $60 level, although the trendline may provide substantial support against deeper losses.
The Relative Strength Index (RSI) stands at 49, reflecting the recent bearish momentum. Traders may consider “trading the range” until a clear breakout or breakdown is witnessed, but confirming the trend direction is crucial to mitigate risk.
Also, a crypto analyst has shared a weekly chart of Litecoin on X, suggesting that LTC is gearing up for a rally to as high as $500. According to the analyst’s analysis, LTC has broken out of a descending triangle pattern on the weekly chart and is currently in a retest and correction phase, setting the stage for a potential bull run reminiscent of a previous significant uptrend.
💎History Doesn’t Repeat, But It Often Rhymes! $LTC pic.twitter.com/BUPQkICNHp
— Anup Dhungana (@CryptoAnup) May 30, 2024


