


Litecoin (LTC) has seen a significant surge in trading volume recently. However, this uptick in trading activity comes amid a bearish sentiment dominating the market, as noted by Coincodex. Created by Charlie Lee to address Bitcoin’s limitations, Litecoin aims to facilitate faster transaction times and enhanced efficiency. Since its launch in 2011, Litecoin has positioned itself as a digital currency optimized for peer-to-peer transactions and online purchases.
Litecoin holds the 19th position in the cryptocurrency market by market cap. Despite a slight 1.12% drop to $6,020,781,558 in its market cap over the last 24 hours, the overall sentiment remains cautious. The increased trading volume, up by 8.55%, suggests significant trader engagement, possibly driven by notable activities within the crypto community.
At press time, LTC was exchanging hands at $80.71, a 1.28% surge from the intra-day high of $82.54.


LTC/USD 24-hour price chart (source: CoinMarketCap)
Its liquidity and trading volume underscore Litecoin’s market presence. With a traded value of $382.24 million and a volume/market cap ratio of 6.28%, Litecoin exhibits strong liquidity. At press time, 74.5 million LTC are circulating in the market, accounting for 88.69% of its maximum supply, and the fully diluted market cap stands at $6.85 billion.
The cryptocurrency’s high volatility, marked at 8.86%, alongside a fear and greed index indicating greed among investors, reflects the complex market dynamics. Supply inflation for Litecoin is relatively stable at 2.26%, contributing to its market stability despite the prevailing bearish trends.
Insights from Derivatives Market
The derivatives market provides additional insights into Litecoin’s current state. Recent data from Coinglass reveals higher long liquidations, indicating bearish dominance. Over the last 24 hours, long liquidations amounted to $208.63K, surpassing the short liquidations of $96.04K. This suggests that bearish sentiment is prevalent, as traders liquidate long positions more aggressively.
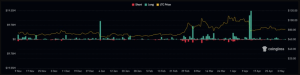

LTC/USD Crypto Liquidity Chart | Source: Coinglass
Additionally, the derivatives volume has surged by 114% in the past 24 hours, resulting in a traded value of $456.29 million. Open interest has also seen a 2.9% increase, pointing to heightened activity and interest in Litecoin derivatives.
Technical Analysis
Technically, LTC’s price action shows it continuously taking support at a dynamic trendline while facing multiple rejections from the same. Despite this, the price remains above the trendline. The recent price pattern on the daily chart displays an inverted hammer at the bottom, followed by subsequent candles breaking the high of the hammer candle, indicating renewed buying interest.
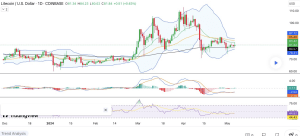

LTC/USD 24-hour price chart (source: TradingView)
Currently trading at $80.34, Litecoin is positioned between the 50-day and 200-day EMAs, signaling market uncertainty. The 200-day EMA is a crucial support level, while the 50-day EMA acts as resistance. The MACD indicators have overlapped, suggesting a range-bound market, while the RSI has been below the 50-level for an extended period, reinforcing the bearish momentum.
As Litecoin hovers around key technical levels, $80 acts as a crucial support level, and $81.50 is the immediate resistance. The market’s next move will likely depend on whether bulls can muster enough momentum to push the price above the resistance or if bears will continue to dominate, pushing the price below the support level.


