


Lido DAO’s LDO token had a slight correction today and was trading at approximately $2. 33, reflecting a 2. 16% decline over the past 24 hours. The price ranged from $2. 33 and $2. 42.This movement suggests that there could be more positive movements or more negative movements depending on the overall market and other crypto-economic events that will occur in the future.
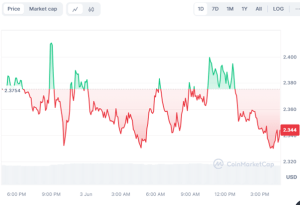

The technical analysis shows that there is a strong resistance at $2. 70, a level LDO briefly rose to before it started to decline. The current price is still trading above the key support level of $2. 45, meaning that if this support is violated, LDO may probe the closest support at $2. 35. The day’s high was at $2. 70 correlates with the recent resistance levels which show that the token cannot sustain higher prices in the market.
Lido DAO’s Bullish Stance and Social Dominance
Lido DAO (LDO) is on the rise in the crypto market, especially with the hype around the Ethereum ETF. LDO has been on a bullish run in the past week with its price rising by over 40%. Currently trading at $2. 33 with a market cap over $ 2. 25 billion, analysts have estimated LDO’s growth rate at nearly 250% due to growing buying pressure and positive market trends, which speaks about its prospects in the segment of competitive crypto apps.
Till mid of March 2024, the social upsurges of tweets had no impact on the price. However, the LDO price has been exhibiting a reaction to the impacts of social dominance in the recent sessions. The social buzz covers 0.04% dominance in the entire crypto world. Conversely, the price rise reflects the increasing approach of users.
Lido DAO Enters a Consolidation Phase Near $2. 34 Amid Market Uncertainty
The LDO/USD pair price analysis shows that Lido DAO is currently in a consolidation phase with the $2. 34 mark, which is an indication of a conservative market disposition. The 2-hour chart depicts the price range moving between the upper and the lower Bollinger Bands which are at $2. 44 and $2. 31, respectively. Currently, the Relative Strength Index (RSI) is at 42, which means that the market is moderately bearish with no signs of significant buying or selling.
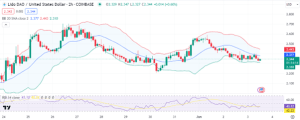

Analyzing the technical aspects, it is noted that the 20-period Simple Moving Average (SMA) is currently at $2. 38, which acts as a dynamic resistance level. The price has to rise above this level to achieve an upward move. It is noted that support is at $2. 31 and a breach of this level may result in a continuation of the downside. It seems that the market is still anticipating a strong signal to trigger the next major movement.


