


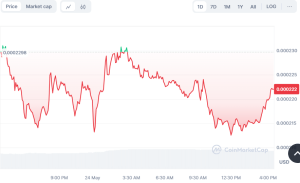
FLOKI Inu, the meme coin currently making headlines for its volatile market behavior, experienced a significant rally this month but has recently encountered resistance that has stymied its upward momentum. As of the latest data, FLOKI is trading at $0.000219, which represents a slight decline within the last 24 hours but still maintains a notable recovery from its recent low of $0.0001695. This movement places FLOKI at the 53rd position in terms of market capitalization, with a substantial valuation of approximately $2 billion

FLOKI On-Chain Dynamics and Market Sentiment
Examining the on-chain data reveals a mixed sentiment among investors. Despite the recent price pullback, certain on-chain metrics suggest underlying strength. The number of daily active addresses has remained relatively stable, indicating sustained user engagement and interest in the token. However, a slight decrease in new address creation could signal a cautious approach from potential new investors.
Moreover, transaction volumes have seen a modest increase, suggesting that while some investors are taking profits, others are seizing the opportunity to buy at lower prices. This activity is further evidenced by the accumulation patterns seen around the support levels.
FLOKI’s trading volume has surged alongside its price, indicating robust trading activity as investors respond to its price movements. This increased volume has been a double-edged sword, providing the liquidity needed for price ascension while also contributing to volatility that has led to sharp price corrections.
FLOKI Price Analysis: Stabilizing Within a Narrow Range
In today’s trading session, FLOKI Inu shows signs of stabilization after recent volatility, with its price oscillating between $0.0002218 and $0.0002298. The hourly chart demonstrates a constrained trading pattern within the Bollinger Bands, suggesting a period of consolidation after the coin’s recent recovery efforts.
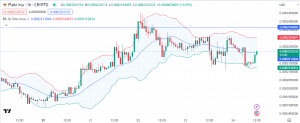

This stabilization phase is crucial as it indicates a potential gearing up for the next directional move. The middle Bollinger Band, currently at $0.0002236, has acted as a dynamic level of support and resistance throughout the day, guiding the price trajectory of FLOKI.
The coin faces a critical resistance level at $0.0002298, which it has tested multiple times throughout the day. A consistent failure to breach this level could reinforce bearish sentiments, potentially leading to further declines. However, if FLOKI can consolidate above this resistance, it might regain its upward trajectory, challenging higher resistances at $0.00023 and beyond.
FLOKI Technical Indicators and Market Sentiment
Technical indicators reflect a cautious market sentiment for FLOKI. The ADX (Average Directional Index) at a low value of 13.72 suggests a lack of strong trend momentum, indicating that the current price movement is more reflective of a sideways market than a clear bullish or bearish trend.
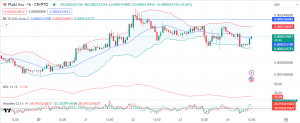
The Woodie’s CCI (Commodity Channel Index) shows a value of 1.61, hovering around the zero line, which corroborates the neutral stance in price momentum. This indicates that while there’s no immediate sign of a strong price surge or drop, investors should keep an eye on key levels for potential breakouts or breakdowns.
As FLOKI continues to trade within this tight range, traders will be closely monitoring these technical indicators and the price’s response to the Bollinger Bands for clues on future movements. A breakout above the upper band could signal a return to bullish momentum, while a drop below the lower band might indicate a deeper pullback is underway.


