


Floki has been trading slightly lower in the last 24 hours. The price of Floki is currently at $0. 0003202, reflecting a 2.2% down from the previous day. The market cap is $3. It has a market capitalization of over $6 billion, making it the 37th largest cryptocurrency. The trading volume within 24 hours is $816—69 million, which is 48% more than the previous year. The trading volume has reduced by 21% compared to last year.
On the daily chart, Floki’s price is volatile starting from $0. 000328 and it was at its lowest before rising to the present level. The circulating supply of Floki is 9. 56 trillion, with a total supply of 9. 69 trillion tokens.
Floki Price Analysis: Current Trends and Market Position
Floki’s price has been in a bullish trend in the recent past. However, in the last 24 hours, the price has retraced a bit and is now testing the support levels. This minor correction comes at a time when the market has been volatile and has affected several cryptocurrencies. However, there is a short-term decline in the index, but the long-term trend is still bullish, according to analysts.

The Floki has been on an upward trend in the last one week. The meme coin has risen from $0. 00023 to above $0. 00034, which rose by a considerable margin today even though there was a slight drop in the market price.
After being outcompeted by other meme coins, Floki has made a major advancement. This has enhanced confidence among investors, and thus, the company has registered an incredible performance.
Floki rose by 24% in the last seven days, capitalizing on the meme coin trend to reach an ATH of $0. 0003462 on 05 May.
With Bitcoin trading above $71,000 and Ethereum crossing $3,100, meme coins are also on the rise. Floki takes the lead with a 70% rise in the last week, while BONK has risen by more than 7% in the last 24 hours.
WIF and SHIB have also strengthened while DOGE and PEPE have only slightly appreciated. This trend shows that there is increasing focus and capital allocation towards the meme coin space.
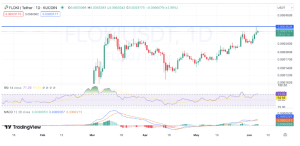
The daily technical indicators for the FLOKI price indicate that the price will rise if it goes above $0. 00033 could face some resistance at $0. 00035, which may disrupt the pattern it has set. Staying above this level may take FLOKI to the next resistance at $0. 00037. If bullish momentum continues, it could reach $0. 00039.
However, if FLOKI goes below $0. 00032, it might drop to the descending support trendline at $0. 00031. A bearish market may cause FLOKI to decline further and reach a support level of $0. 0003. These levels are important for defining the further movement of FLOKI.
The daily technical indicators for FLOKI on the daily chart show that the bulls are in control. The Relative Strength Index (RSI) is at 72. 73, which is above the upper line of 70, this is an indication of overbought and this means that there is strong buying pressure.
The MACD line is above the signal line and the histogram bars are in positive territory which supports the upward movement. The 20-EMA is positioned above the 50-EMA, which is a bullish signal for the market.


