


The FLOKI price was trading at $0.0001919 as of 5:00 am EST, up 10% over the last 24 hours.
The dog-themed memecoin was riding on the hype that gripped the crypto market after the return of the Roaring Kitty, the X account associated with retail stock trader Keith Gill.
On May 13, Gill posted on X for the first time since June 2021, sharing a photo featuring an image of a man leaning forward with a controller.
— Roaring Kitty (@TheRoaringKitty) May 13, 2024
Users on X and Reddit interpreted it as Gill signaling them to enter a period of focus, colloquially termed as “locking in.”
The return of Roaring Kitty caused a memecoin rally, with top-cap memecoin, PEPE rallying 33% on May 14 to new all-time highs. Popular memecoins like Dogecoin (DOGE) and Shiba Inu (SHIB) also experienced modest gains, rallying by 4.53% and 1.5%, respectively, according to data from CoinGecko.
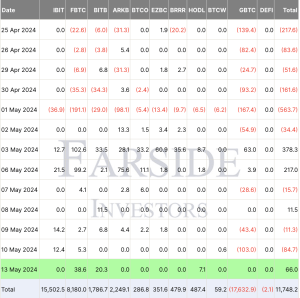

Top-cap memecoins. Source: CoinMarketCap
Following the post from The Roaring Kitty, Solana-based GameStop memecoins (GME) and the AMC token surged over 350% and 900%, respectively.
Stocks associated with Gill and other meme-related companies also surged, with GameStop’s pre-market trading experiencing a 44% climb, briefly surging by 113% post-market open before trading was paused.
The question becomes if this move is sustainable or not.
This is the closest meme stocks have gotten to the momentum seen in January 2021.
Tomorrow is a huge day where we’ll find out if this move can hold.
Follow us @KobeissiLetter for real time analysis as this develops.
— The Kobeissi Letter (@KobeissiLetter) May 14, 2024
AMC Entertainment Holdings also experienced a 12% increase in pre-market trading and surged 25% after the Wall Street opening bell on Monday.
FLOKI bulls eye 50% gains to $0.0002887
FLOKI’s price action has led to the appearance of an ascending triangle on the daily chart, as shown below.
This is a significantly bullish chart pattern used in technical analysis. It is created by price moves that allow for a horizontal line to be drawn along the relatively equal swing highs and a rising trendline to be drawn along the higher lows. The two lines form a triangle.
The chart pattern is confirmed when the price breaks above the triangle’s resistance line, leading to a breakout on the upside. The target is determined by calculating the distance between the thickest points of the triangle and adding it to the point of breakout.
At the time of writing, FLOKI’s price was fighting resistance from the triangle’s horizontal line at $0.00020. An hourly close above this level would confirm an upward breakout from the governing chart pattern.
If this happens, the price of the memecoin could rise from the current levels first toward the psychological level at $0.000250 before reaching the technical target of the ascending triangle at $0.00028870. This would bring the total gains to 50.98%.
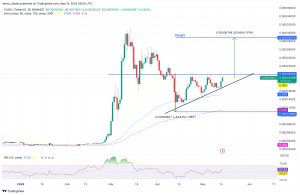

FLOKI/USD daily chart. Source: TradingView
Apart from the bullish chart pattern, the rising RSI supported FLOKI’s bullish narrative. The price strength at 64 suggested that the market conditions still favored the upside.
On the downside, a daily close below the triangle’s hypotenuse at $0.000168—embraced by the 50-day EMA—would spell doom for the token, with the 100-day EMA at $0.000152 providing the first line of defense. Additional support lines would emerge from the $0.000140 and the 200-day EMA at $0.00010.


