


Floki has witnessed the market’s ups and downs over the past week. Floki recently encountered a significant downturn, shedding 38.09% in the past 7 days and 19.14% of its value in the last 24 hours to settle at a price of $0.0001674 as of writing today 19th March, 2024. This decline, while concerning, has not deterred the digital asset’s supporters, who remain steadfast in their belief in its potential.
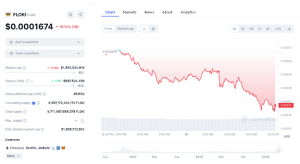

Floki Data Chart (Source: CoinMarketCap)
Despite the setback, Floki’s considerable trading volume solidifies its position as a significant player in the cryptocurrency realm. With a market capitalization of over $1.5 billion, Floki continues to command attention and spark speculation about its future trajectory, including the tantalizing prospect of reaching the coveted $1 valuation.
Amidst the speculation, Floki’s resilience and burgeoning presence in the cryptocurrency ecosystem have been noteworthy. As it navigates the choppy waters of the market, Floki finds itself pitted against its rival, Bonk, in a battle for dominance and investor confidence.
Floki 1 – Day Technical Analysis
Floki’s daily chart reveals a bearish trend since its recent high of $0.00031500 on March 14th. The current price of $0.00016900 is testing a crucial support level. If this support is breached, further downside towards the $0.0009250 zone could materialize. Conversely, a breakout above the $0.00031500 resistance could catalyze a rally towards the all-time high of $0.00035953 and beyond.
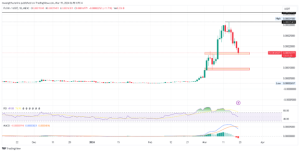

FLOKIUSD 1 – Day Price Chart (Source: TradingView)
Today’s candlestick opened at $0.00019245 and has traded between a high of $0.00019451 and a low of $0.0001610, displaying significant volatility. The Relative Strength Index (RSI) sits at 49.88, hovering near the midpoint, while the MACD remains in negative territory, indicating bearish momentum.
The daily technicals paint a mixed picture, with Floki precariously poised at a critical support level. A decisive move in either direction could dictate the near-term trajectory of this cryptocurrency.
Floki 4 -Hour Technical Analysis
The 4-hour chart for Floki reveals a critical support level at $0.00016900. Analysts are closely monitoring this zone to gauge whether a breakdown or a rejection will unfold. A breach of this support could potentially trigger further downside towards the $0.0009250 level.
However, if the current support holds firm, it could signal a potential rejection and pave the way for a rally towards the previous high of $0.00031500. Should Floki manage to surpass this resistance, the prospect of testing the all-time high around $0.00035953 becomes increasingly feasible.
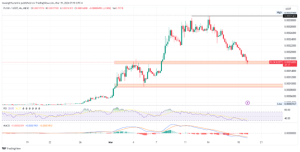
FLOKIUSD 4- Hour Price Chart (Source: TradingView)
The Relative Strength Index (RSI) on the 4-hour timeframe currently stands at 28.05, indicating an oversold condition. This reading often precedes a potential trend reversal, especially when coupled with a support level like the one Floki is currently contending with.
Meanwhile, the Moving Average Convergence Divergence (MACD) indicator is slightly negative, suggesting the presence of slight bearish momentum, with the potential for a shift in sentiment.
The 4-hour technicals highlight the significance of the $0.00016900 support level, which could act as a pivotal point, determining whether Floki continues its downtrend or embarks on a recovery rally.


