


Fetch.ai (FET) opened the day at a slight decrease, maintaining a narrow trading range before experiencing a sharp decline. The price dropped from $2.0683 to a low of around $2.02, marked by increased trading volume, suggesting a sell-off. The price then slightly recovered, pushing up to $2.03, indicating some buying interest at lower levels.
Fetch.ai’s market cap has seen a 1.78% decrease, bringing it to approximately $1.72 billion. The trading volume over the past 24 hours has increased by 12.55%, amounting to about $175 million, indicating higher than usual activity in the market. This can often correlate with price volatility, as observed in today’s movements.
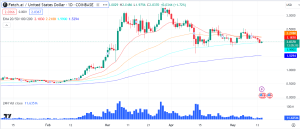

A potential “death cross” is on the horizon, with the 50-day EMA approaching the 200-day EMA from above. This technical pattern often signifies a strong bearish shift in momentum.
Currently, the crucial support level to watch is around $1.96, which has been tested several times but not yet broken. If this level holds, Fetch.ai might see a rebound to higher resistance levels at $2.26 and potentially $2.46 if it turns into support.
The sentiment among investors is tilting towards caution, with a decline in network growth suggesting decreased interest in acquiring FET tokens. The Historical Break Even indicator shows that the majority of holders may be looking to sell, as over 97% of the tokens are held at prices above the current market price.
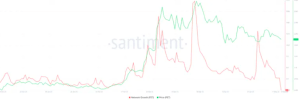

Fetch.ai Network Growth. Source: Santiment
Fetch.ai’s current market conditions and technical analysis suggest a bearish outlook in the short term, with significant price support at $1.96. A break below this level could lead to further declines, whereas a rebound from it could signal a potential recovery. Investors should monitor these levels closely in the coming days.
Fetch.ai Forms a Tentative Rebound on the 4-Hour Chart
The recent performance of Fetch.ai (FET) as viewed on the 4-hour chart from Coinbase shows a challenging trend with bearish tendencies. Over the past few sessions, FET has demonstrated a descending pattern, with the price falling from a high of $2.0486 to a low of $1.9756.
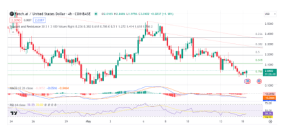

The recovery to the current price of $2.0437 marks a minor rebound, but the overall trend appears dominated by sellers. This is further substantiated by the resistance levels mapped at Fibonacci retracement points, notably around the $2.1 mark, which could serve as a critical barrier for any potential upside movements.
The chart indicators provide additional insights into the market sentiment and momentum. The Moving Average Convergence Divergence (MACD) shows a close proximity between the signal line and the MACD line, suggesting a potential bearish crossover, which may indicate further declines if confirmed.
Meanwhile, the Relative Strength Index (RSI) is nearing the 40 level, a sign that the asset is neither in the oversold nor overbought territory, but leaning towards a weaker buying momentum. The price stability around the 0.786 Fibonacci level suggests a pivotal zone for Fetch.ai’s short-term direction, with a definitive break or bounce at this point likely to set the tone for subsequent price actions.


