


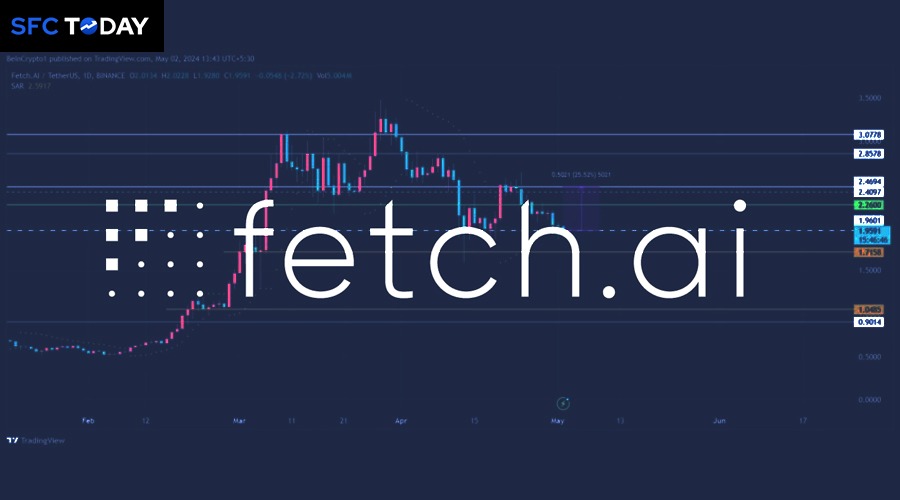
As the cryptocurrency market experiences volatility, Fetch.ai (FET) has become a focal point for many investors and analysts. Currently, Fetch.ai’s price is hovering near a precarious support level at $2.2206. The recent price action has put the altcoin under the microscope, with market participants closely monitoring its ability to sustain above this critical threshold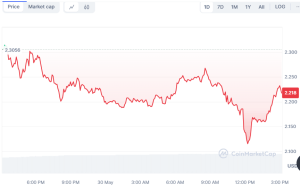

A significant concern for Fetch.ai is the observed decline in network growth, reaching its lowest rate in over seven months. This metric, which tracks the formation of new addresses on the network, is a crucial indicator of user adoption and overall market traction. The slowdown suggests a waning interest among new investors, potentially signaling a decrease in future transactional activity on the network.
Market Value to Realized Value (MVRV) Ratio Indicates Caution
The Market Value to Realized Value (MVRV) ratio, another vital indicator, is currently signaling a bearish outcome for Fetch.ai. The 30-day MVRV stands at 12%, indicating that a significant portion of holders are in profit and may start to sell off their holdings to realize gains. Historically, when the MVRV ratio falls within the 7% to 30% range, Fetch.ai has faced corrections, pointing to a potential sell-off if the trend persists.
From a technical perspective, Fetch.ai’s immediate support lies at $2.22. If this level fails to hold, the next potential downside target could be as low as $1.95, a scenario that would underscore the bearish momentum. Conversely, if Fetch.ai manages to rebound and break above the resistance level at $2.49, it could pave the way for a move towards $2.85, challenging the current bearish sentiment
Fetch.ai (FET/USD) Price Struggles Within Bollinger Bands as Indicators Show Mixed Signals
Fetch.ai’s price is currently showcasing a tight consolidation pattern within the Bollinger Bands on the 4-hour chart. The recent trading session has seen FET/USD moving from a high of $2.2354 to a low of $2.1060, eventually closing at around $2.2206.
This indicates a modest rebound after testing the lower boundary of the Bollinger Bands. Such price behavior often suggests a phase of uncertainty among traders, as the price compresses in anticipation of a potential larger move.
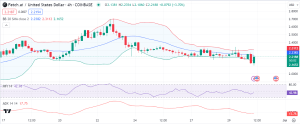

From a technical standpoint, the Money Flow Index (MFI) and the Average Directional Index (ADI) present a mixed outlook. The MFI, currently at 42.87, indicates that the market is neither overbought nor oversold, suggesting a balanced flow of money in and out of Fetch.ai.
However, the ADX, at 17.75, signals a weaker trend strength, indicating that the current price trend lacks significant momentum. This could potentially lead to a continuation of the sideways movement unless external market forces or significant volume changes come into play.


